AbstractFinding the right balance between the nutrient abatement objectives and the regulation of adaptive bottom–up solutions is of the utmost importance in solving the nutrient-loading problem.
Antti Iho
Senior Scientist, Natural Resources Institute Finland
Creating an ecologically sustainable circulation of nutrients requires local solutions with commitment from all participating parties. Due to vast differences between various regions, it is very complicated, if not impossible, to create fair, simple, and applicable legislation that can consider all of these differences in a meaningful way. Thus, there is a need for clear and easy ways of developing sustainable and viable solutions locally, as well as communicating them with local community and all the way up to the supervising governmental representatives. To meet this need, we developed a simulation tool that allows the user to explore the effectiveness and impact of a local biorefinery in waste management. As an iterative model based on state machine agents, it can easily be modified for a multitude of scenarios with changes taking place over time, while considering the viewing points of all involved. In this article, we report the first version of this tool and demonstrate its usefulness in estimating suitable biogas reactor size in a biorefinery.
Introduction
Animal husbandry, food production, and soil fertilizing in agriculture all include streams of organic mass that are used in production processes. A large portion of the nutrients of these materials are contained in the secondary outputs, that is, side streams of material, such as manure and industrial side streams. In the interest of more efficient resource usage, it is desirable to collect these nutrients back to circulation with the ecosystem of industries and primary production. Equally important is to be able to manage the distribution of nutrients into the environment in an ecologically sustainable way, that preferably promotes biodiversity also. In addition to the refined nutrient content of outputs, organic mass is suitable for biogas production that can be used in heat and electricity production, and also as transportation fuel.
Local nutrient recycling from waste and side streams managed on a community level would be an effective way of testing the environmental load and controlling the human made impact to the environment. However, due to the number of actors involved at various stages of the agricultural processes, and their sometimes contradicting legislation and personal motivations, current top-down governance slows down the introduction of new technical applications. The paradigm should be shifted to enable the creation of local solutions (Belinskij et al, 2019). One option to increase the understanding of such complex systems is via transdisciplinary computational modeling, where it is possible to include asymmetrical hierarchies between actors and analyze the temporal behavior of the individual actors, as well as the system as a whole (Roodt, 2015; Roodt & Dempers, 2020). Simulation modeling as a form of digital innovation allows the risk-free exploration of different scenarios and business models to facilitate planning and operations. In the work prepared for this paper, we created a first version of a simulation tool to analyze local feedback loops of nutrients and energy through a biorefinery. Our aim was to provide insights to a wicked problem (Pidd, 2010), through building and using a tool to analyze and simulate nutrient streams that depend on multiple variables, as well as to support decision making towards ecologically sustainable and commercially viable solutions.
The manure management chain consists of activities that safely collect, store, process, and relocate this otherwise problematic material. Biogas is seen as an essential step in this chain and it requires a holistic approach to the whole process (Luostarinen, 2013). Biogas technology was seen in 2013 as the most suitable way to produce energy from manure and cycle its nutrients. Furthermore, biogas plants can be scaled from small household digesters to centralized biogas plants (Luostarinen et al, 2011).
Here, we introduce a biogas reactor and a holistic approach to the wider context with a locally centralized biorefinery that processes waste and side streams from several sources. This biorefinery yields biogas and other re-usable, added-value products, such as nutrient concentrates and biochar. The nutrient outputs of the biorefinery are envisaged to be written into a database that will form the basis for feedback in the loop. Also, we tracked the number of driven kilometers used when transporting the waste from its production source to the biorefinery, thus enabling checks to ensure that the amount of produced energy and value of other products, for example, nutrient concentrates, exceeds the costs of making them. We will refer to this tool with the acronym REBIA: Regional Biorefinery Impact Assessment.
REBIA was designed to allow easy adjustment of waste stream sources and biorefinery locations. The GIS locations of these facilities are specified in an input file. Waste is transported via the road network from its various sources to the biorefinery via routes obtained from the cloud application OpenStreetMap. This is used to calculate transportation costs. In this initial model, we did not constrain the transport fleet thus allowing as many trucks to transport the waste as required. REBIA combines system dynamics and agent-based functionality and can therefore be extended to incorporate a wide range of heuristics and procedures even if no analytic model can be provided. These include, for example, the effect of weather in nutrient distribution in the soil, and different types of production rates and changes. These details will be included at a later stage of our work when the model is extended.
A major use of REBIA is for developing a nutrient circulation business model. Industrial and agricultural companies currently purchase energy, raw materials, fertilizers, and feed, considering this as a separate business process from their waste management operations. Often waste management is also an expense for the business, though exceptions exist where, for example, animal waste can be used to fertilize their own crop fields. The private sector is subject to environmental policies from the government or community. With REBIA, it is possible to analyze the regional circulation of waste, energy, and nutrients in a model where the biorefinery provides new added value to the chain that is missing from traditional processes. Via computational analysis, it is possible to evaluate which regional partners benefit from joining the biorefinery value chain, and whether there are any critical aspects that need to be considered or have a contingency option to ensure safe continuation of the circular economy in this regional collaboration. In addition to this, decision makers of environmental policies can use REBIA to assess if compensation models are beneficial or needed.
In this paper, we describe the details of our first phase REBIA model and demonstrate its usefulness in assessing a bioreactor’s size and its required storage volume, as well as the effect of a policy change in a specific manure treatment scenario. We show the simulation results of four experimental cases from the region around the City of Kangasala, Finland. This region provides an interesting area for our research since it contains both a large food industry factory in the countryside and nutrient intensive agriculture. This combination of animal husbandry and a related food industry creates local nutrient load hot spots. Even a small number of these hot spots can generate a significant nutrient load risk to the Baltic Sea. Thus, the management of nutrient streams is important.
Development of the Simulation Tool
REBIA was developed with AnyLogic™ simulation software. Anylogic™ is a Java based multi-paradigm modelling application that incorporates GIS and supports the mixing of System Dynamics, Agent Based, and Process Centric Modelling paradigms. The main view of REBIA is shown in Figure 1, where the waste feed sources and biorefinery locations are shown with a visualization of trucks delivering waste.
In this model we identified three main role players that we defined with three agent types: Waste Feed Source, Vehicle, and Bioreactor. Different types of waste are generated at a waste feed source and vehicles transport the waste to the biorefinery, where the waste is converted into commercially valuable products. The model is initialized by an input file from MS Excel that defines the GIS locations and the number and parameters of each waste feed source. This allows easy customization of the model for other areas. It is possible to drill down for more details by clicking on a site to open a detailed view of the internal processes of the feed site (Figure 2). In addition to the adjustable parameters for each agent, the transport vehicle capacity and bioreactor weekly intake volume can be adjusted globally in the initial REBIA implementation.
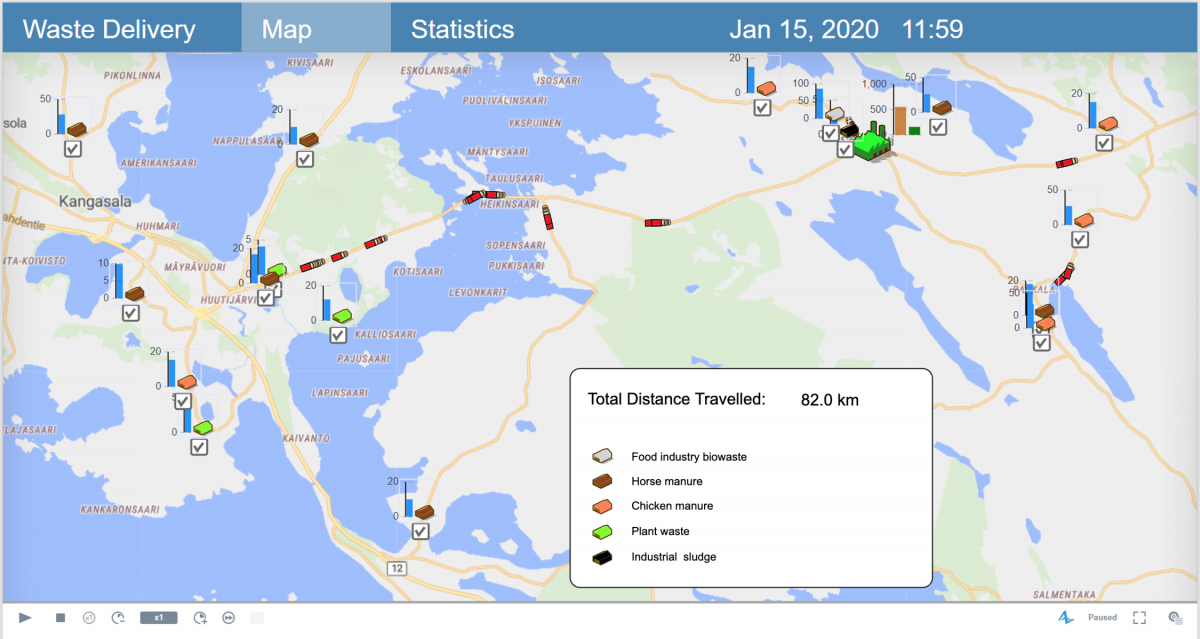
Figure 1. Main view of the simulation interface. Waste collection from sites can be switched on or off, either before or during the simulation run. Optionally, truck visualization can be turned off for faster computation.
Waste feed source
We considered five different types of waste streams: industrial sludge, food industry biowaste, horse manure, chicken manure, and plant waste. Each of these waste streams has a characteristic nutrient composition. During model initialization of Rebia, multiple agents are created, each with a different GIS location and belonging to one of the five waste streams. Each site also has a user configurable number of vehicles allocated to it.
A system dynamic component calculates waste generation and utilization. Waste is assumed to be created at a constant rate, while some agents also utilize their own waste locally (for example, fertilize crops on the farm). The consumption is modeled with a constant rate, which is much smaller than the waste generation. Waste would therefore accumulate at each source and would then be transported by vehicle to the biorefinery. On average, truck transportation is initiated once per week, provided that more than a truckload of waste is available, and only if the site is active (NB: it is possible to disable deliveries from a site by unticking a selector block).
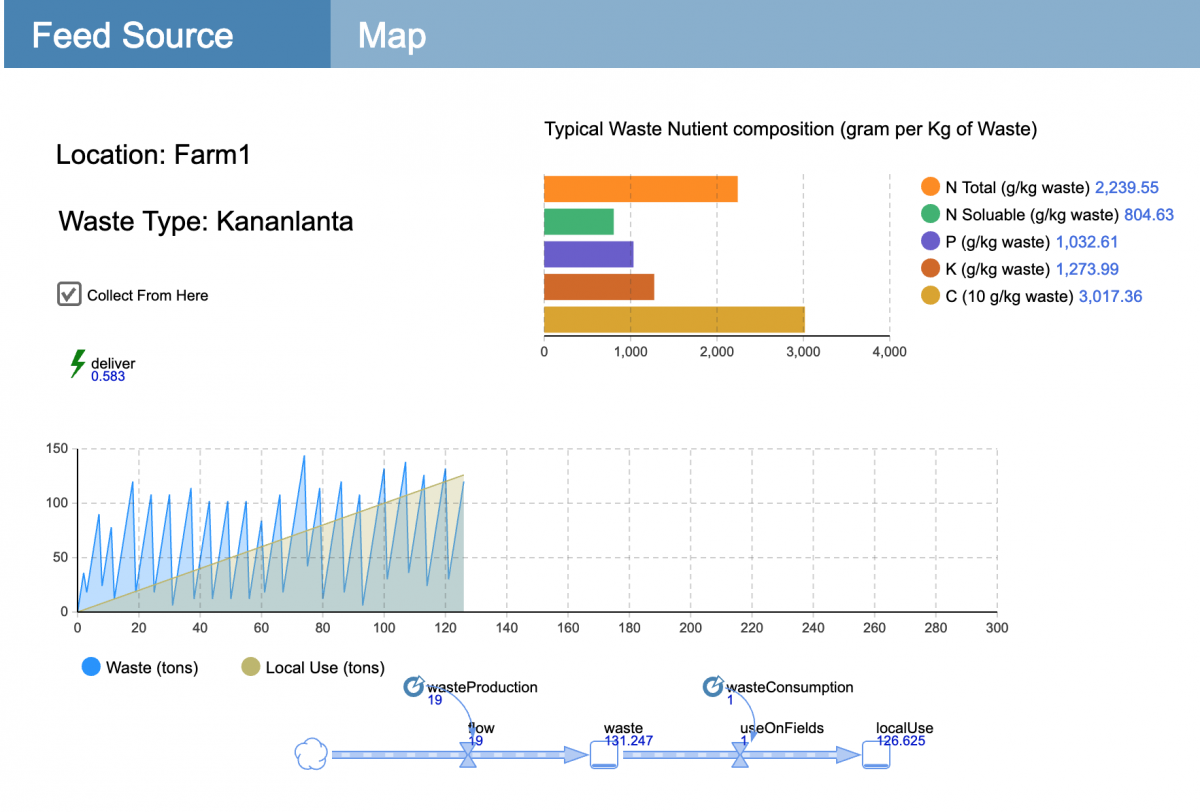
Figure 2. The waste feed source window shows the local waste volume and local use (if applicable to the site) Regular transport to the biorefining plant should keep the average waste on site constant. Typical nutrient components of the feed type are also indicated.
Vehicle
During model initialization the number of trucks allocated to each waste feed source (termed waste plant in the model) is generated. The vehicle workflow is defined with a state chart and incorporates loading and offloading times. A system dynamic component keeps track of the distance travelled. The vehicle is assumed to travel at a constant speed of 80km/h on its way to and from the Biorefinery. The loading process is triggered by the arrival of a message generated from the waste plant. Loading will only commence if the amount of available waste exceeds the loading capacity of the vehicle. Vehicle agent state chart is shown in Figure 3.
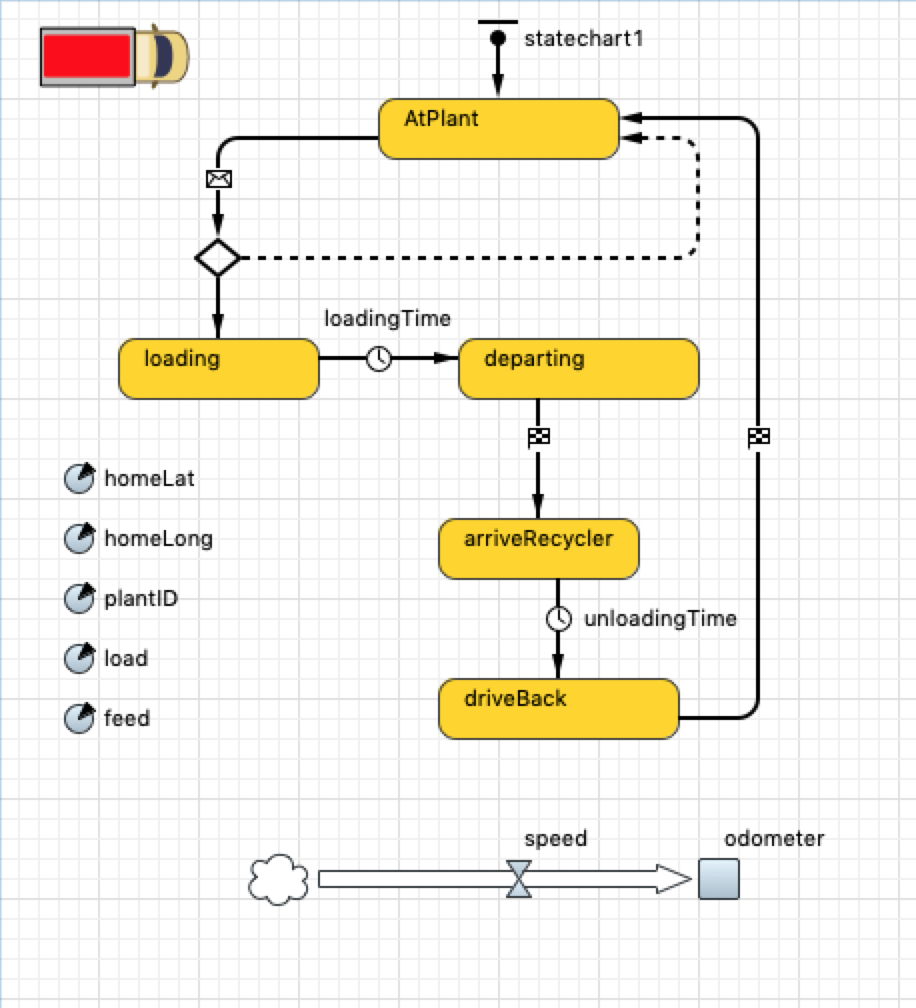
Figure 3. The Vehicle agent contains a state chart that controls its behavior, and parameters that are read or set at runtime.
Biorefinery
The above-mentioned waste materials - manures, plant waste, food industry sludge, and biowaste - are all bio-based raw materials for the local biorefinery. In this study, the materials were upgraded in the biorefinery via several processes for nutrient, carbon and energy rich products, as summarized in Figure 4. The main part of the biorefinery is a biogas plant based on anaerobic digestion of feed materials that result in the production of biogas and digestate. The amount of biogas, its methane concentration, and energy value, are calculated based on experimental data from the specific gas production potential of each feed material obtained by the AMPTS® (Automatic Methane Potential Test System) (Bioprocess Control, n.d.). All the nutrients from the feed materials remain in the digestate, which is separated into a solid fraction and a liquid phase, that produces reject water. The dissolved nutrients, like most of the nitrogen, are in the reject water, which is concentrated by membrane filtration resulting in a nitrogen rich concentrate and permeate. The nutrients in the permeate are further utilized for cultivating microalgae. A solid fraction of about 30% of the dry solid content obtained in the separation is dried before the pyrolysis, meaning the production of biochar. The mass flows of carbon and nutrients along with the total mass flows are calculated based on experimental data from the sub-processes under steady-state conditions.

Figure 4. A simplified flow sheet of the biorefinery concept. Material phases are marked with non-filled blocks and process phases with filled blocks. Flows in the image are not based on scale.
The internal processes of a biorefinery are calculated with an analytical model implemented in Microsoft Excel (Microsoft Excel for Office 365 MSO 16.0 64 bit). Excel performs mass flow calculations where the biorefinery is assumed to perform in steady state where we assume that there are no transient states between changes of input feed composition nor when initializing the processing plant. We have made a static analysis that input streams to the biorefinery are suitable for processes when there are no major changes in the input. REBIA can be developed further to allow reacting to non-ideal input, for example, by having a buffer of nutrients to mix into the composition, or by running the biorefinery at a lower performance level. Ideally, the static MS Excel model should be replaced by a dynamic model of biorefineries, including feedback loops and dynamic behavior based on examples of changes in feed composition and process temperature.
REBIA uses the biorefinery model to transform waste into a value stream of energy and nutrients based on waste infeeds. It does so by stockpiling incoming waste shipments and then feeding the waste into its reactor at a constant rate. REBIA incorporates a summary view that displays the arrival of waste, stockpile, and processed material at the plant, as shown in Figure 5. The Excel implementation of the model is effectively used as a function to calculate these values, which is accomplished by writing to Excel’s input cells and then calculating and reading nutrient values from output cells. The model collects daily activities into a table and provides a statistics view, as shown in Figure 6.
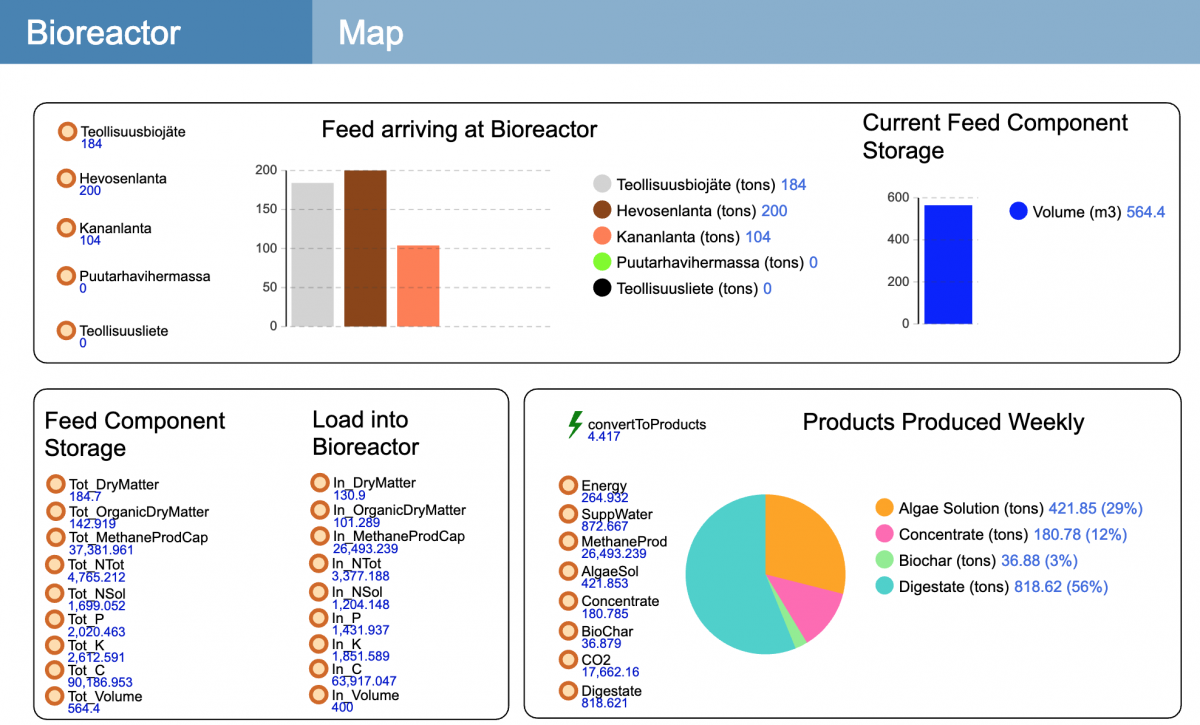
Figure 5. The biorefinery model view contains the cumulative amounts from all sites by waste feed category and the total volume of the stockpile. A chart summarizes the value manufactured products.
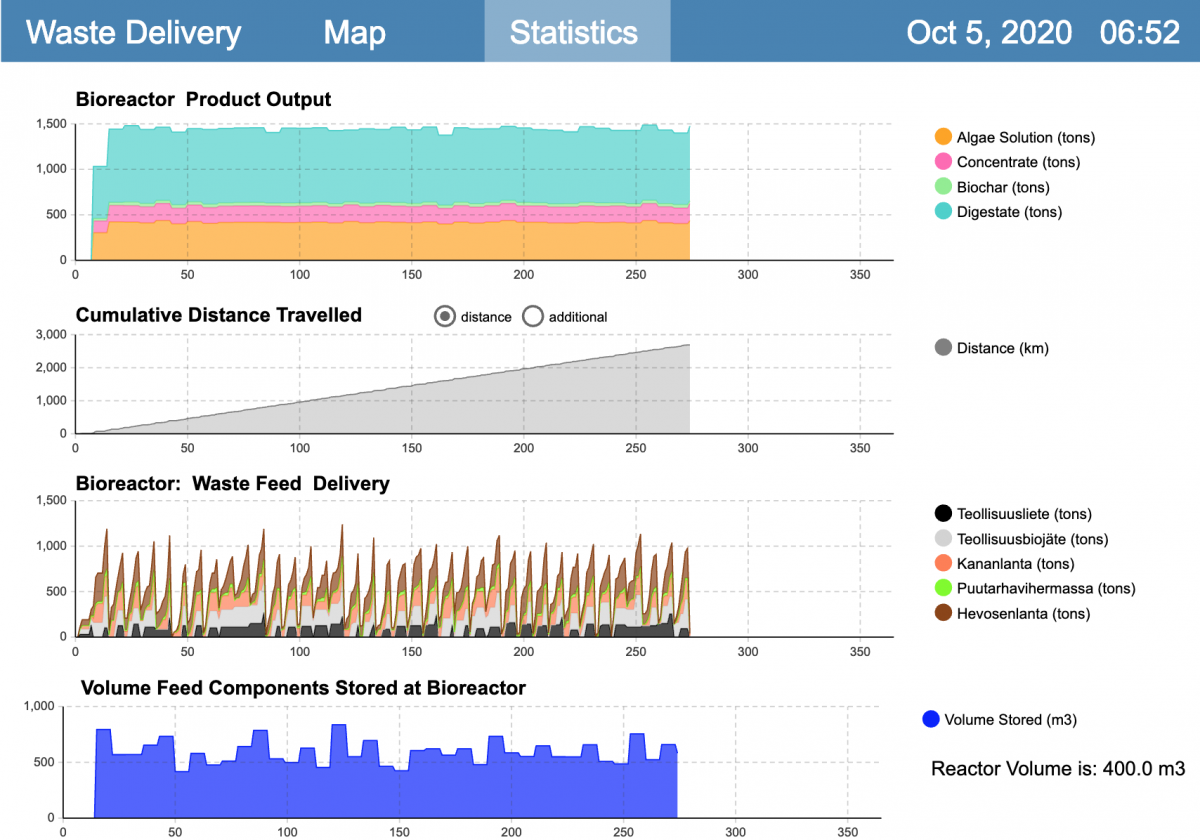
Figure 6. Statistics view. Main parameters of the system are collected into single view that can be exported to a spreadsheet for further analysis. The charts are set to display data that simulates one year.
Simulation Experiments
To demonstrate REBIA’s performance, we report four experimental simulation cases. The first two simulation experiments were both run for a 10-year period and all the waste stream locations were active. Experiment 1 and Experiment 2 only differed in the capacity of the transport vehicles and the process intake capacity of the biorefinery. In Experiment 1, the vehicles were eight-ton trucks and the biorefinery was able to process 400 m3 of waste per week. In Experiment 2, the trucks were twelve-ton trucks and the biorefinery was able to process 500 m3 of waste per week.
In Experiments 3 and 4, truck and biorefinery sizes were as in Experiments 1 and 2 respectively, while the experiments were also run over 10 years. After the first three years, collection from horse sites was discontinued. These experiments simulated the case of, say, changes in regulations that horse manure must be transported elsewhere, or the discovery of a new technical innovation that allows more cost-efficient local use of horse manure.
When comparing experiments, the amount of kilometers driven in Experiment 2 , 24,290 km, was less over the study period than Experiment 1, 36,450 km. This was expected as the truck size was bigger in Experiment 2. Also, as seen in the histogram from Figure 7, the average amount of feed waste stored at the biorefinery stockpile was less in Experiment 2 at 485 m3, compared with 584 m3 in Experiment 1.
In Experiments 3 and 4, by removing horse manure sites after year 3 from input feed production, the kilometers driven over the whole period decreased to 19,055 km and 12,696 km, respectively. The output of the biorefineries in Figure 8 shows a slightly higher product output for these experiments after year 3. This may be attributed to the change in composition of the waste infeed into the reactor, though since transient states were not modeled, the change may not be accurate. The average feed waste stockpile decreased from 349.6 to 250.7 m3. Examining the histograms in Figure 8, it is clear there were several occasions where the stockpile was depleted. Thus, it is possible to see how the REBIA tool can be used to determine the minimum stockpile size, while maintaining a safety margin.


Figure 7. The Statistics view of outputs from Experiments 1 and 2, and a histogram of the weekly volumes of stockpile storage.

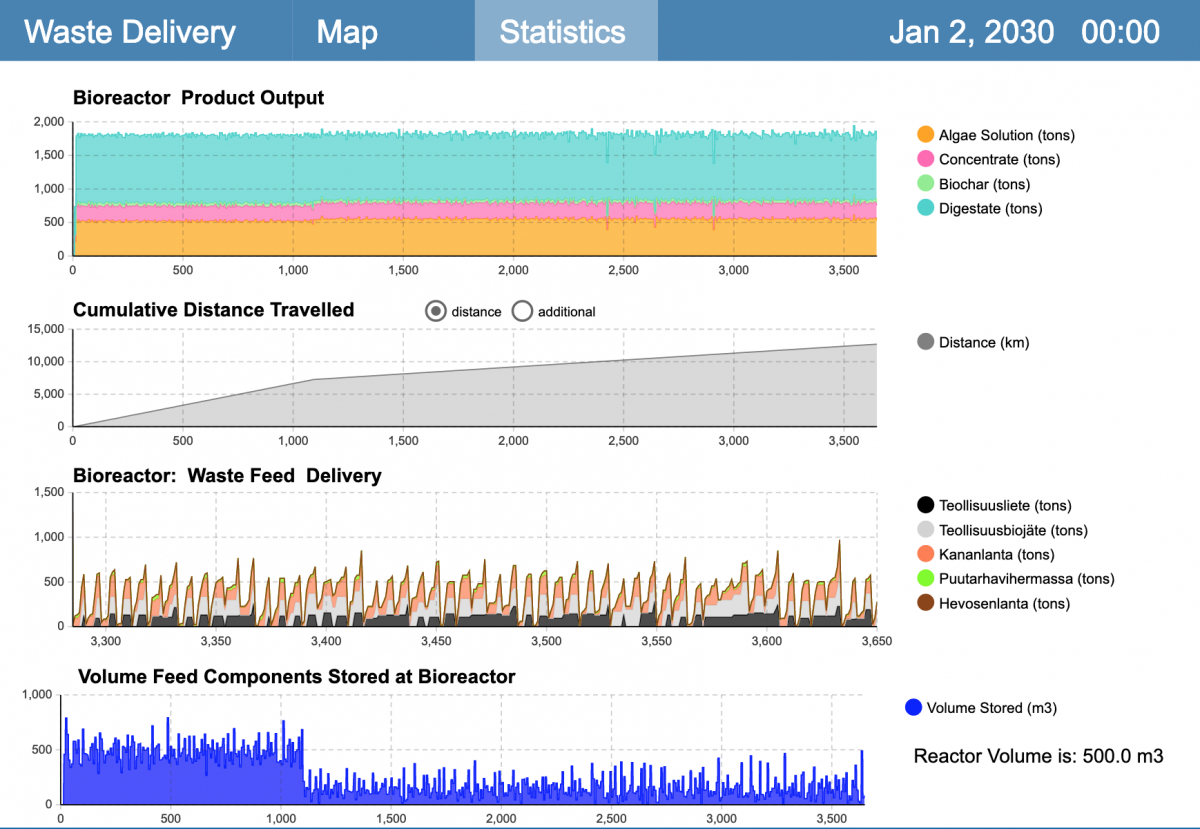

Figure 8. The Statistics view of outputs from Experiments 3 and 4, and a histogram of the weekly volumes of stockpile storage.
Conclusion
The strength of REBIA as a type of agent-based simulation is its easy applicability in viewing regional development from different perspectives. Since it considers the regional ecosystem as a whole, it allows agents configured to make business decisions from their individual perspectives, and then simulating and testing the effect of these decisions to the rest of the ecosystems. This is an extremely important feature, as a community can perform better when everybody has something to gain, that is not a zero-sum game with winners and losers.
With our simulation, it was possible to pinpoint problems on the individual level and create solutions towards win-win situations, such as creating new sellable products (compensation mechanisms), or subsidiaries for an action that has overall benefits in decreased costs elsewhere. Similar aims with different approaches have also been studied in UNISECO project (UNISECO, n.d.), where solutions to environmental problems are being developed bottom-up, from the grass-roots level towards the policy makers, rather than the other way around as has been the case in the conventional approach.
Future development for this simulation tool includes work on optimizing transport (frequency and vehicle capacity) and optimizing the storage location with respect to transport capacity and biorefinery performance, via a push vs. pull business rule. That is, the tool’s current implementation schedules deliveries according to the waste source schedule. An alternative is to place an order for the type and volume that the reactor requires. This feature will also have an impact on stockpile requirements.
REBIA is specifically designed to allow easy modification and scaling to any desired region. It can be used to determine where a biorefinery should be located, the quantity of waste involved, and the distance to waste stream sources. Through analysis of the data it provides through regular usage it is designed to help decision making from local actors to governmental supervisors and create motivation in the community around the whole refinery chain, where the actions are considered as moving towards both ecologically and economically sustainable.
Acknowledgements
This work was funded by the Finnish Ministry of the Environment (Enhancement of nutrient recycling by a local bio-cycle-model project) and the Finnish Ministry of Education and Culture (Bioeconomy 4.0 and Carbon 4.0 projects).
References
Belinskij, A., Iho, A., Paloniitty, T. and Soininen, N. 2019. From Top–Down Regulation to Bottom–Up Solutions: Reconfiguring Governance of Agricultural Nutrient Loading to Waters. Sustainability, 11(19): 5364. DOI: doi.org/10.3390/su11195364
Bioprocess Control (n.d.). AMPTS® II. Automatic Methane Potential Test System. Retrieved in January, 2021: https://bioprocesscontrol.com/bpc_products/ampts-ii/
Luostarinen, S. 2013. National scenarios, best practices and recommendations for manure energy use in the Baltic Sea Region. Baltic forum for innovative technologies for sustainable manure management.
Luostarinen, S., Normak, A., and Edström, M. 2011. Overview of biogas technology. Overview of Biogas Technology. Baltic manure WP6 Energy potentials, 47.
Pidd, M. 2010. Why modelling and model use matter. Journal of the Operational Research Society, 61(1): 14-24. DOI: doi.org/10.1057/jors.2009.141
Roodt, J.H., and Dempers, C. 2020. Addressing Challenges of the Circular Economy using Model-Based Co-Creation and Systems Design. INCOSE International symposium, 30(1): 94-108. DOI: doi.org/10.1002/j.2334-5837.2020.00710.x
Roodt, H. 2015. The Recursively Generative Nature of Complex Agri-Eco-Socio-Technical Systems: A Transdisciplinary Approach to Developing a Low Carbon Footprint Farming System. 2015 Annual IEEE Systems Conference (SysCon) Proceedings, 521-526. DOI: 10.1109/SYSCON.2015.7116804
UNISECO (n.d.). Retrieved January 31, 2021: www.uniseco-project.eu
Keywords: Bioreactor, circular economy, nutrient recycling, simulation, waste management