AbstractEvery morning in Africa, a gazelle wakes up, it knows it must outrun the fastest lion or it will be killed. Every morning in Africa, a lion wakes up. It knows it must run faster than the slowest gazelle, or it will starve. It doesn't matter whether you're the lion or a gazelle – when the sun comes up, you'd better be running.
Christopher McDougall
Author and journalist
Technology companies scan the competitive arena for patents to discover research activities and technology trends. Patents are the outcome of innovation processes that take several month or even years, depending on the industry. The process of publishing patents usually lasts longer. A huge time gap of up to several years between early research and development activities and published patents is the consequence. Therefore, a patent is a weak indicator for the identification of early innovation activities. However, the inventor needs intellectual assets such as data, knowledge, and expertise to carry out an innovation process. It is likely that these intellectual assets can improve the competitor analysis – rendering them primary targets. In this article, we introduce a systematic approach to detect intellectual property (IP) activities of stakeholders in selected technology fields (e.g., hiring experts, taking part in research projects, gathering specific data). A technology field with a low intensity of IP activities offers great opportunities, which we call a "white spot". Our proposed approach can help identify the white spots in innovation-driven IP management and thereby help devise recommendations to improve a company’s IP portfolio.
Introduction
Creative and innovative companies are most successful worldwide. Most of these companies rank innovation as a top strategic priority (BCG, 2013). Nevertheless, the innovation object itself is changing. In former times, physical product and production innovations have been most relevant. Today, we can observe that service and business model innovations are increasing and become even more important (The Economist, 2015; Osterwalder et al., 2014). Companies carrying on service and business model innovations are among the largest and most influential worldwide (BCG, 2009).
What we observe is the transformation from a product manufacturer to a solution provider, and intellectual property management is one of the success factors executing this paradigm shift. In the past, intellectual property management has not been more than the documentation of innovation processes (Sonneck, 2014). However, the transformation needs an active management of intellectual property (IP) – even more, it has to lead and direct the innovation processes (Wurzer & Berres, 2011). Successful companies are showing what can be done. For example, Vorwerk, an international retail and direct-distribution company founded and headquartered in Germany, has invented a new IP strategy especially for their currently most important product: “Thermomix”. The key aspect of their new strategy was a decision to stop applying for patents in an arbitrary way. Technical invention no longer trigger their patent process. They integrate IP management in the innovation process and, today, they use IP rights to protect their value proposition. Furthermore, the technical inventions follow Vorwerk's IP strategy (Wurzer & Schaeffner, 2015). Their subsequent success shows it was a wise move: there is no competitor who is able to offer a product with the same value proposition.
A company's IP strategy forms part of the innovation strategy and thus significantly increases the innovative capability of the company (Wurzer & Berres, 2011). The most important habits of IP winners in the innovation context are: a focus on value; freedom to operate; an eye on the future; a lean and focused organization; putting a premium on speed; and emphasizing quality over quantity (BCG, 2014).
To win, companies must manage their internal IP while having an eye on the external IP activities of stakeholders, competitors, and suppliers. Appropriate actions might include hiring experts in new technology fields, taking part in collaborative research projects, gathering specific data, and – of course – applying for patents. IP activities can be defined as the professional management of the whole IP of a company with the aim to create new high-quality organizational worth from immaterial assets (Mittelstaed, 2016). The evaluation of such external IP activities in upcoming technology fields creates different insights. On the one hand, there are technology fields with a high intensity of IP activities. On the other hand, there are technology fields with a minimal intensity or even no IP activities. In other words, there are upcoming technology fields where no competitor has (or is building up) IP in this area. We call such technology fields, which are mostly free of competitor IP, "white spots". White spots represent unaffected/untainted and circumscribed areas on an IP technology landscape.
White spots offer great opportunities for innovative and creative companies. Innovation projects around a white spot can lead easily to competitive advantages. But the key question is: how does a company detect white spots? In this article, we present a systematic approach to innovation-driven IP management that is designed to detect white spots. In the following section, we provide an overview of existing approaches to external IP evaluation. Next, we give some insights into our understanding of strategic IP management by introducing the IP management process and framework. This is followed by the main part of this article: the approach for innovation-driven IP development. The approach consists of five phases: i) technology preselection, ii) stakeholder analysis, iii) stock-of-IP investigation, iv) stock-of-IP display, and v) decision support. The result of the approach is an IP technology landscape that is the basis for recommendations for action. Finally, we discuss the key findings and provide conclusions.
Existing Approaches to External IP Evaluation within the Competitive Arena
In this section, four relevant scientific approaches and methods are reviewed with a focus on the identification and evaluation of (technological) IP activities of stakeholders in the competitive arena:
- Technological competitor analysis: The technological competitor analysis helps to early identify technological innovations of relevant competitors. It is divided into five phases: i) determining the information needs, ii) provisioning resources, iii) extracting information, iv) evaluating information, and v) utilizing information (Lange, 1994). This is one of the first approaches that focuses on a comprehensive utilization of information about the technological innovation process of competitors. But the publication of this method was in 1994, when the role of the Internet was not significant. Therefore, this concept describes a manual identification of information that differs significantly from a semi-automated and Interned-based search process. Furthermore, the limitation of this method on technology aspects differs from the approach presented in this article, which considers the whole range of immaterial assets or IP in relation to selected technologies.
- Competition monitoring: The provision of current, former, and future information about competitors in order to support strategic, operative, and tactical decisions is the aim of the competition monitoring process (Deltl, 2011). In particular, the derivation of key intelligence topics is a useful tool to define the observation field. However, the documentation of the method and the visualization of findings and results are insufficient. In addition, the method does not focus on the identification of technological activities – resultant specifics are not taken into account.
- Competitive intelligence cycle: The competitive intelligence cycle has the aim to achieve competitive advantages by identifying and analyzing (fragmented) information. Competitive intelligence includes competition analysis, competitor analysis, competitive analysis, and strategic foresight (Michaeli, 2006).
- Digital intelligence: Digital intelligence helps to detect traces of human or machine activity left in digital media. Traces can be found in patents, scientific articles, or on websites, for example. The digital intelligence supports the decision maker by identifying complex connections and weak signals (Walde, 2010). It also opens the opportunity to detect technological changes around the company.
These approaches give an overview of the research into identifying and evaluating competitor information within the competitive arena. They all pursue the idea of gathering this information to create competitive advantages. But what are the main challenges regarding that target? First, the observation field must be clarified. Second, the identification and evaluation must be efficient – ideally supported by IT tools. And third, the graphic preparation must fit management requirements. The method presented in this article combines this three prerequisites:
- It uses the definition of IP to determine observation fields.
- It uses automatic search algorithms in the identification process.
- It creates a visualization concept to present the IP landscape to management.
Next, we describe the process of strategic IP management and the framework behind the method.
Strategic IP Management
Today, the intangible value of a company amounts to approximately half of its market value, which has risen from the 1980 value of 20% and is set to further increase in the future (Wurzer & Berres, 2011). Therefore, the strategic management of IP is one of the most valuable efforts a company can make, particularly if its focus is technology or even manufacturing. The strategic management of IP is the synergetic combination of IP rights, customer, management, and brand management – especially communication and marketing (Mittelstaedt, 2009). IP management is a part of modern strategic product planning and innovation management (BCG, 2014). In light of this combination, we describe strategic IP management as a holistic approach for the identification, protection, and activation of intellectual property or rather intellectual capital (Eckelt & Gausemeier, 2015). The process of strategic IP management is described below and is illustrated in Figure 1.
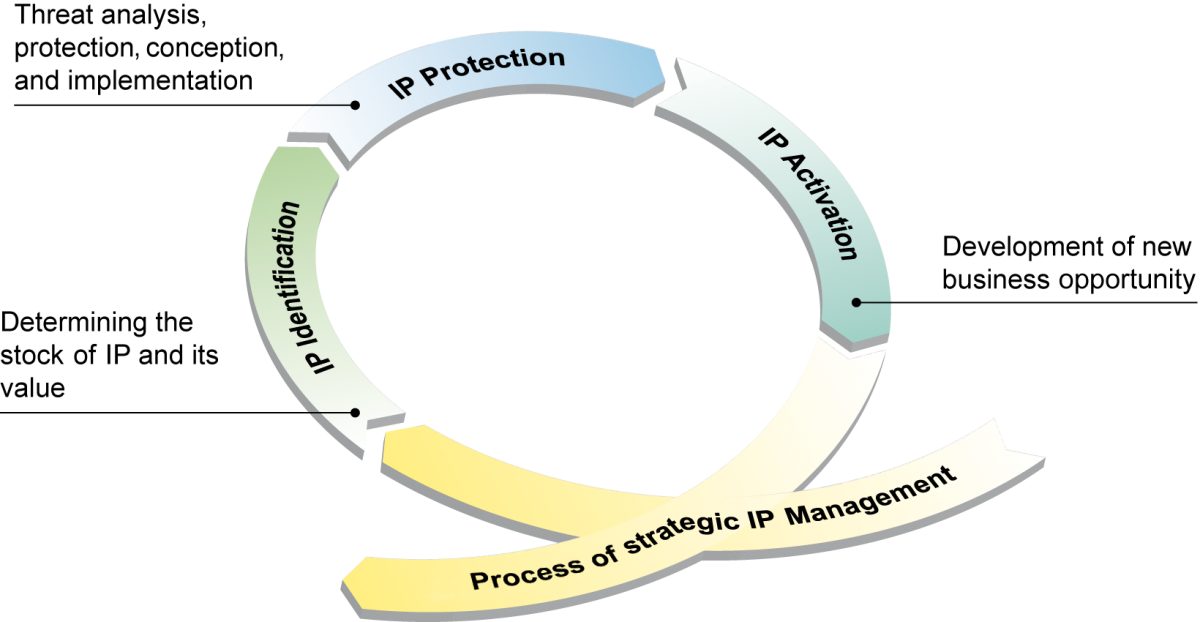
Figure 1. Process of strategic IP management
1. IP identification
The first phase in strategic IP management is IP identification (both internal and external). The goal of this phase is to increase the transparency of already existing IP and to discover IP requiring greater attention in the future. Therefore, IP identification includes steps to take stock of the IP inventory and to forecast future IP. In the literature, there are already approaches that describe this aspect of the approach, such as “Knowledge Balance – Made in Germany” (BMWi, 2013) and “Intellectual Capital Collection” (Kneisel et al., 2012). Nevertheless, these approaches do not consider the IP forecast nor the identification of white spots. Besides the identification of IP, we furthermore suggest the identification of intellectual capital (IC). IC can be divided into three sections: human capital, structural capital, and customer capital (Stewart, 1997). Human capital describes personal-influence factors that affect the intangible assets of a company. It includes, among other things, the competencies, skills, and motivation of the employees. Structural capital includes IP and externalized knowledge in the form of procedures and processes. Customer capital describes influence factors that have an external effect on, for example, relationships with suppliers or customers (Nagel, 2012).
2. IP protection
Technical innovations, brands, and designs as well as human, structural, and customer capital should be protected to retain competitive advantages. Whereas the classical protection of inventors focuses on IP rights, modern protection efforts create a holistic set of organizational, technical, and legal measures, among others. To develop this set of measures, three steps are necessary. First, a threat analysis detects influence factors that affect the security of IP. Influence factors include customer proximity, the business model, and the price strategy. For example, a weak customer proximity has a negative influence on the security of IP. Within a catalog of 76 influence factors the 10 most critical factors are selected. Second, measures are combined to a consistent protection concept, which is tailored to the threat situation. Another catalog with over 100 measures is available for this step. Third, the launching of different measures is visualized in an action plan or a roadmap (Eckelt et al., 2014; Gausemeier et al., 2012; Meinwald, 2011).
3. IP activation
There are always opportunities for capitalization, innovation, or optimization behind IP. Very often, many of these opportunities are unused. For example, data is a structural capital with a high potential but it frequently has low utilization. Microsoft and many other firms provide further examples: they identified the potential of their customer relationships and the large knowledge base of their customer by building a platform or online community where customers can share their experiences with other customers (e.g., Microsoft Community). The wealth of firms can increase by this approach (Manchanda et al., 2015); however, the goal of this phase is to develop new business opportunities.
Alongside the process of strategic IP management, we developed a documentation canvas, which we call the IP management framework (Figure 2). The framework includes five models: property, resource, protection, offer, and finance. By carrying out the process in Figure 1, the framework is filled in box by box; the colors indicate which process pays into which model. In the next section, we provide a more precise description of IP identification with an emphasis on external IP.
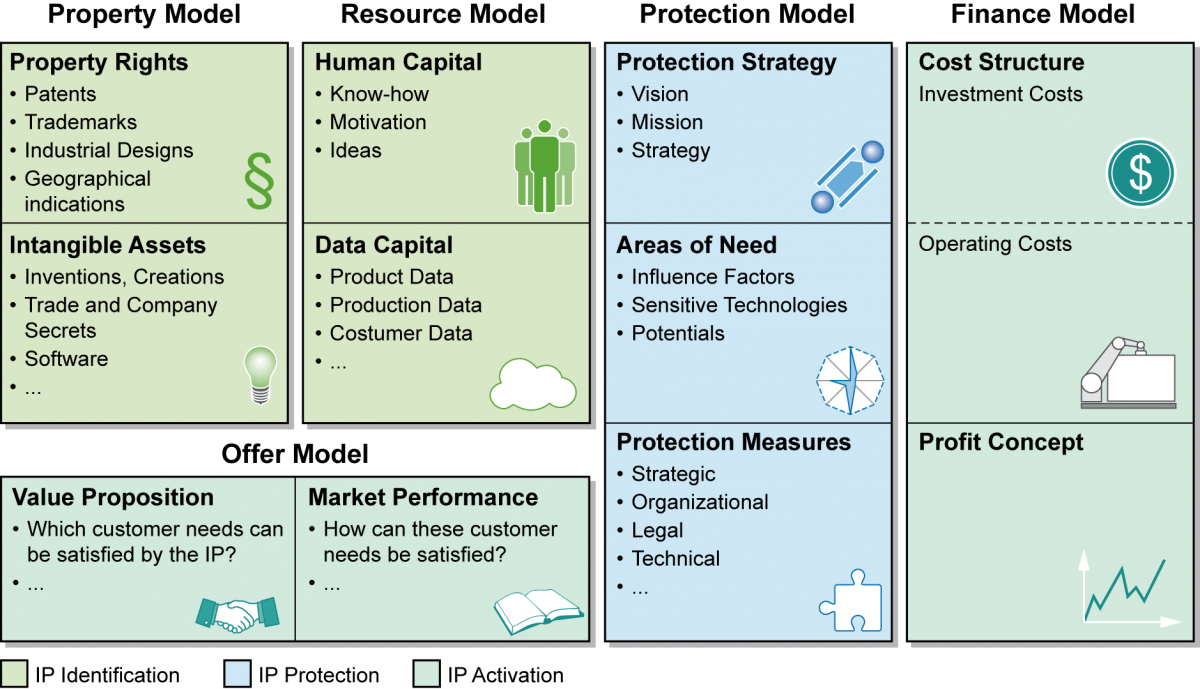
Figure 2. IP management framework
Approach for Innovation-Driven IP Development
These days, the acceleration of the technological progress, the increase of global competition, and the exponential growth of knowledge are key challenges for companies. Innovative technologies provide excellent possibilities for companies to face these challenges by enabling competitive advantages, at least temporarily. To remain successful in the market over the long term, a company must identify changes in the corporate environment as early as possible. The process of identifying and evaluating strategically relevant information is usually named competitive (technology) intelligence. The aim of competitive (technology) intelligence is to provide a reliable basis for the decision makers of a company (Gausemeier et al., 2014; Wellensiek et al., 2011; Zollenkop, 2006). In this context, one fundamental issue is the amount of IP held by participants in the competitive arena of certain technology fields – and how it changes over time. Such knowledge, including which participants in the competitive arena are working on which technology field, is of high value for a company.
The challenge of this work is to provide a methodology that enables a company to identify relevant participants in the competitive arena in certain technology fields and to identify and evaluate the stock of IP held by relevant participants in specific technology fields. Technology fields that are not yet covered by IP from their participants IP are potential innovation fields. Therefore, the exponential growth of knowledge – more specifically, the huge amount of available and potentially relevant information – must be managed. Relevant questions in this context are:
- Who are the relevant participants in the competitive arena?
- What stock of IP do they have in certain technology fields?
- How will the stock of IP of the relevant participants change/develop in the future?
- Which technology fields are so far not (or are nearly not) covered with IP by participants?
The five phases of our methodology for innovation-driven IP development are described below and are illustrated by Figure 3. An iterative process enables the company to detect dynamic changes, as highlighted by carrying one example (additive manufacturing) through the explanations of the methodology.
Phase 1: Technology preselection
The broad observation of a company’s environment is linked with a huge amount of potentially relevant information. Because of this, it seems not to be useful to identify and evaluate the IP of the whole company environment in relation to a reasonable expense of a company. So, as a first step, the observation area has to be reduced. For the development of an IP technology landscape, a rough preselection of technology fields raises the practicability of the methodology considerably (Zeller, 2003). Possibly relevant technology fields can be ascertained by the company itself or by looking into well-known scientific publications, such as the McKinsey Global Institute's (2015) “Disruptive Technologies: Advances that Will Transform Life, Business, and the Global Economy”, Gartner's (2015) “Hype Cycle for Emerging Technologies”, or Siemens' (2015) “Pictures of the Future” (Siemens, 2015). For the example used in this article, we use the McKinsey technology fields, knowing they are too diverse for a single company.
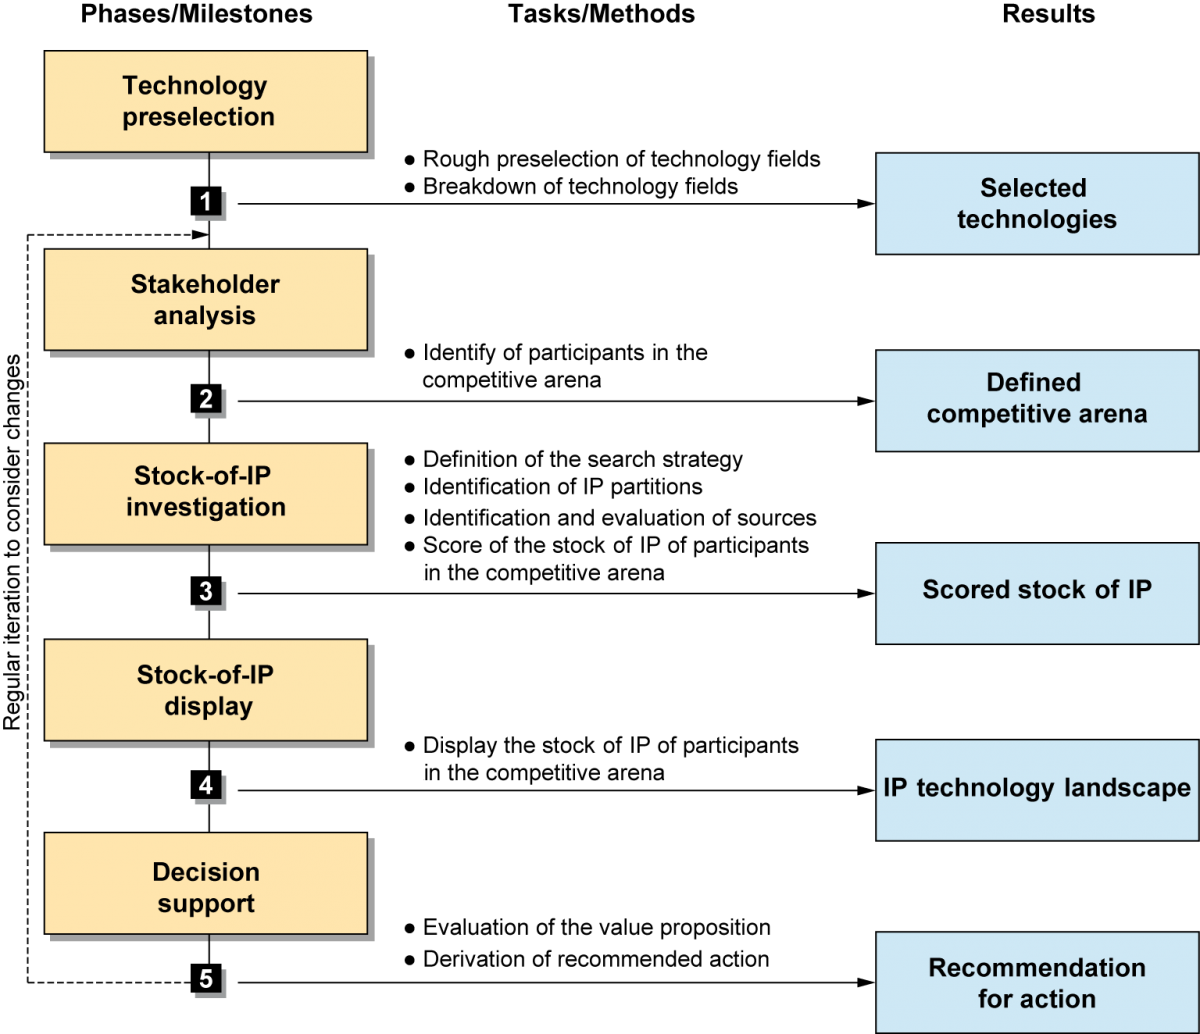
Figure 3. Process model for defining IP recommendations for action
To select the technology field(s) to monitor, a bubble chart can be used, as shown in Figure 4, which illustrates a hypothetical example of the classification of technology fields for a medical-technology company. The bubble chart classifies different technology fields by the two axes: estimated prospects of success (e.g., cost-saving potential) and estimated implementation costs (e.g., required know-how). Technology fields in the bottom-right corner (low prospects of success and high implementation costs) usually can be disregarded. Technology fields placed in the bottom left or top left are useful to gain operative or tactical technological improvements over the near term or medium term. For strategic, long-term planning, the top right technology fields are most promising (Peitz, 2015).
In the example shown in Figure 4, the technology fields of additive manufacturing, advanced materials, and energy storage now can be selected for further monitoring. Depending on the specific requirements of the company, a breakdown of each preselected technology field is useful to select a practical observation level (i.e., a suitable abstraction level). For each of the preselected (broken down) technology fields, a profile is built, as shown in Figure 5.
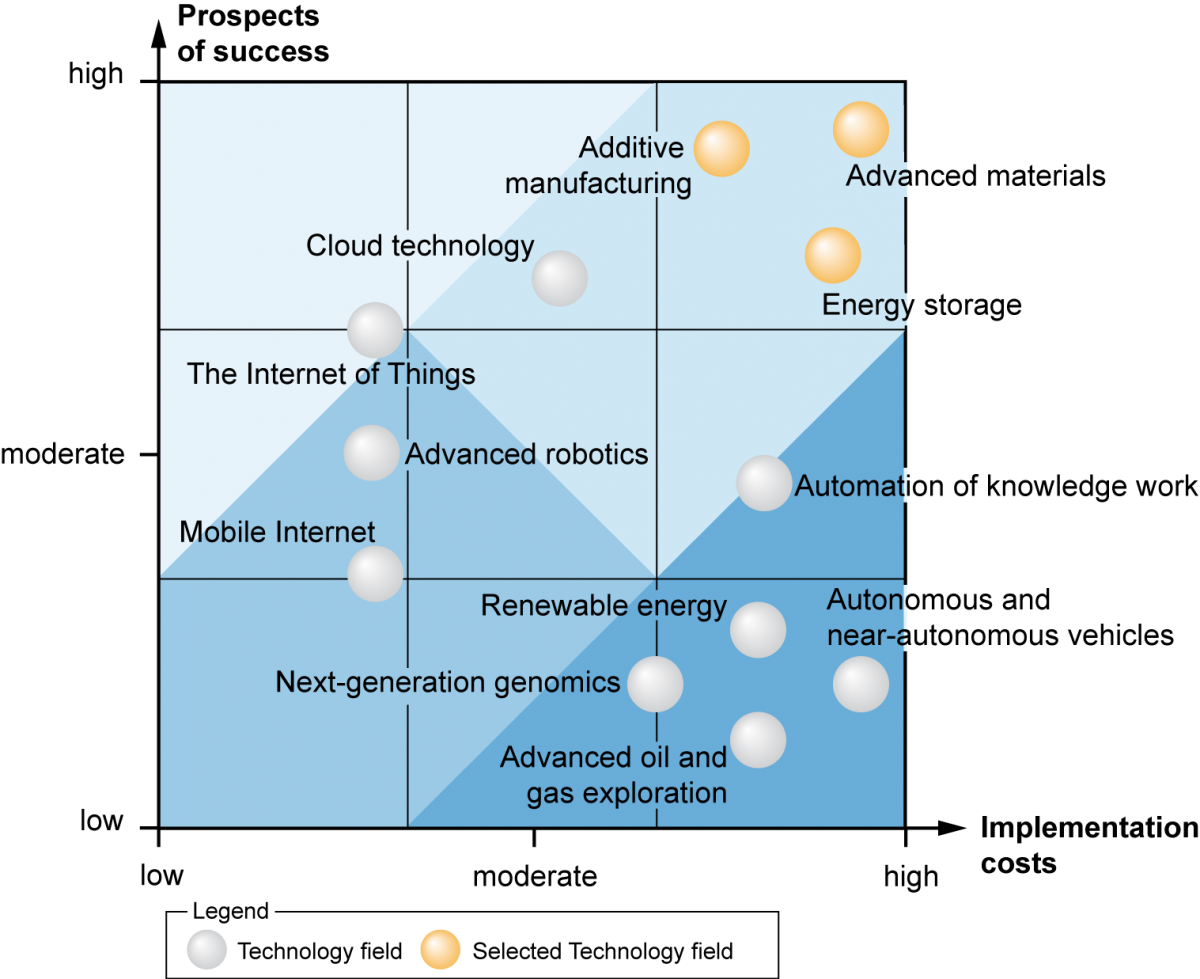
Figure 4. Hypothetical classification of technology fields for a medical-technology company
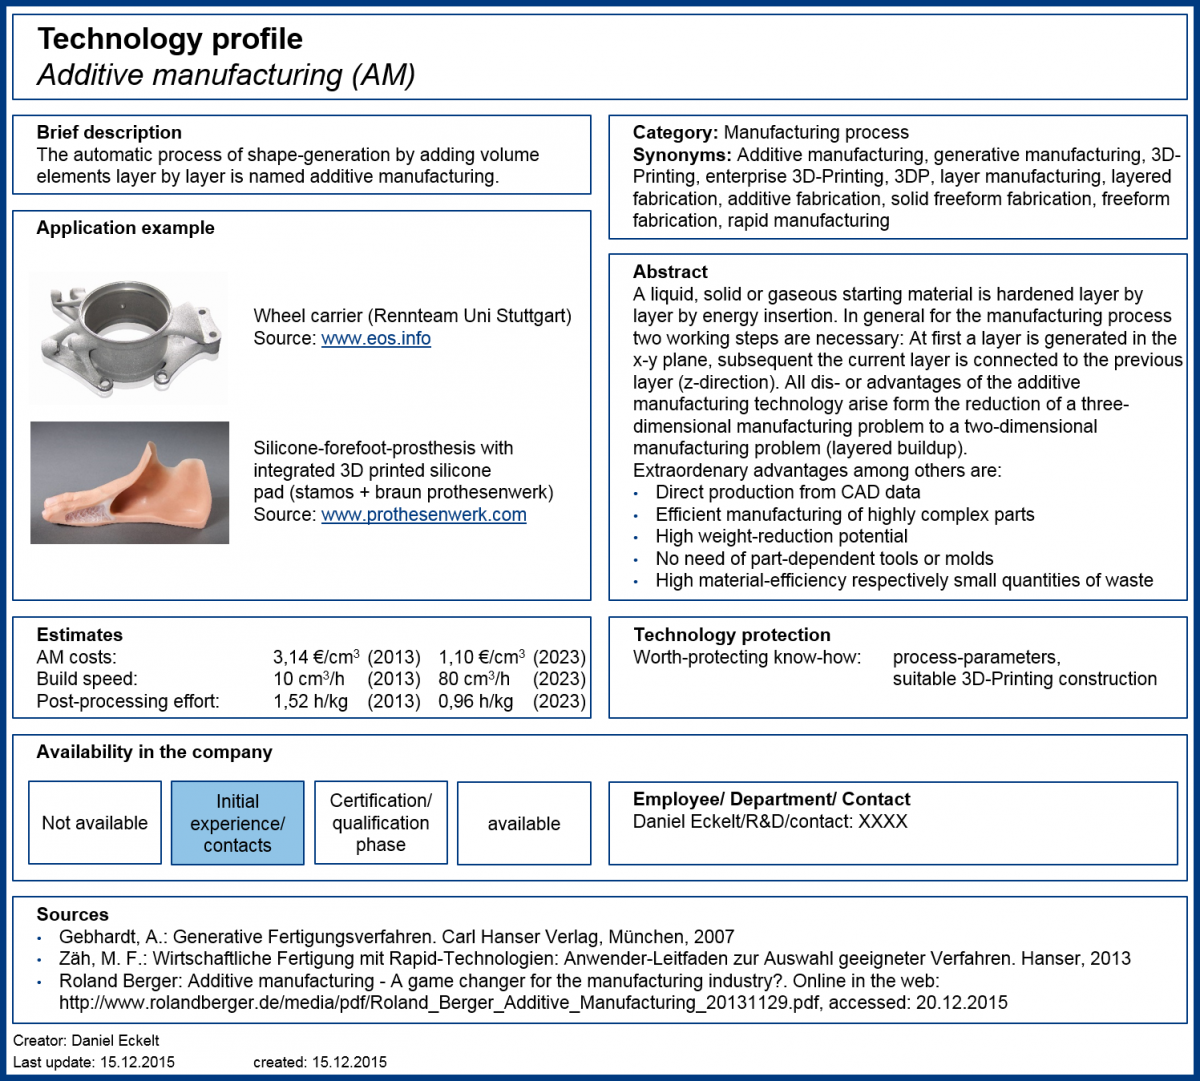
Figure 5. Example profile of the additive manufacturing (3D printing) technology field
Phase 2: Stakeholder analysis
The aim of Phase 2 is to identify relevant participants in the competitive arena, which can be divided into three groups:
- Competitors
- Technology suppliers
- Others (customers, research institutes, etc.)
Initially, known participants are sorted into the three groups. At first, the list of potentially relevant participants does not need to be complete, because further participants can be added easily during subsequent iterations of the process. Because of the high number of participants, it is helpful to cluster very similar participants. For a rough assessment, the relevance of each participant can be represented in an aim-power matrix. Therefore, the competition policy of each participant is assessed on a scale from -5 (very high conflict potential) to +5 (very high cooperation potential) and is shown on the y-axis (aim). The x-axis of the matrix describes the estimated position of power for each participant on a scale of -5 (dominant power position of the participant) to +5 (dominant power position of the company). The assessment of competitors can use sales or market segments, for example. Participants that are placed in the top right corner of the matrix (called "followers"), offer a high potential for cooperation; participants in the top left (called "godfathers") are able to exercise significant influence in a potential cooperation. Participants in the bottom left have a dominant market position and are called "killers"; participants in the bottom right (called "cannon fodder") are perceived as weak. Figure 6 shows an extract of an aim-power matrix of participants in the competitive arena of a medical-technology company for the technology field additive manufacturing.
As a result of this process, the relevant participants for further monitoring can be selected. Monitoring of participants that are located at the four corners of the matrix (marked light blue) is recommended. The investigated intelligence about each (relevant) participant is stored in a participant-profile (see Figure 7).

Figure 6. Aim-power matrix for participants in the competitive arena of a medical-technology company

Figure 7. Profile of a participant of the competitive arena
Phase 3: Investigation of participants' stock of IP
Phase 3 is the main part of the procedure. The aim of this phase is to investigate the stock of IP for participants in the competitive arena. Therefore, the search strategy and the search query must be defined. Afterwards, the stock of IP of participants in the competitive arena is scored.
Phase 3.1: Definition of the search strategy
To search for the stock of IP, it is necessary to define a search strategy, which starts by determining who searches how, for what, and where? (Echterhoff, 2014).
The answer to the question of who searches depends very much on the company’s skills and resources. Basically, two possibilities exist: either the search is realized by the company itself or the company commissions an external service provider (Echterhoff, 2014). The presented method is designed to enable companies to perform the search on their own.
The question of how the search is executed refers to either a manual or a (semi-) automatic search process. To face the previously named challenges such as the exponential growth of (potentially relevant) knowledge, the focus of this work is on an (semi-) automatically search process.
To answer the question what is searched for, different partitions of IP must be considered. The what-question is linked very closely to the where-question. It must be considered that (in some countries) some very useful sources cannot be accessed; for example, it is not possible (or allowed) to contact the employees of another participant in the competitive arena in which the stock of IP shall be investigated. Therefore, the what-question is limited by the where-question. In the context of the presented procedure only public, disposable intelligence is used to investigate a participant's stock of IP.
Interim conclusion: The process requires a (semi-) automatic search process that considers the different partitions of the IP of participants in the competitive arena by accessing only public, disposable intelligence and that easily can be executed by a company itself.
As shown in Figure 2, this work uses a broad understanding of IP. There are three types of intellectual capital (IC): human capital, structural capital, and customer capital. Some types of these types can be investigated externally (by the company as an external observer). For example, to investigate components of the human capital of a competitor, the current vacancies of the competitor can provide important intelligence. Components of the structural capital, for example, can be investigated by looking at a competitor's research cooperations. Customer lists as a part of customer capital are another useful source of intelligence about competitors. To assess a competitor's current vacancies, online job portals run by the competitors themselves or by third parties may be examined. Subsidy databases or press releases can be used to collect intelligence about cooperation of or between participants in the competitive arena. Press releases of a competitor can also be used to identify their customers. Figure 8 shows how the different types of competitor IC can be investigated, including example components and information sources.

Figure 8. Excerpt of an investigation into a competitor's three types of intellectual capital (IC)
Next, the different sources must be scored in regard to practicability. For a (semi-) automatic search process, a source can be rated on the basis of two aspects: automatic evaluability and intelligence content. Automatic evaluability refers to existing possibilities to extract search results from different sources. Some sources only allow (legally or technically) a manual download of search results or an automatic export may be possible only with considerable time or expense. In terms of intelligence content sources may differ in terms of the quantity and quality of intelligence about a participant in the competitive arena. In addition, the currency of the source is an essential factor in this context.
For the example of current vacancies of a competitor, it has to be considered that not every competitor or participant advertises vacancies on its own website or a commercial job platform. The intelligence content of sources and the automatic and manual download of search results from the different sources are scored in the bubble chart example shown in Figure 9. The website stepstone.de (shown in the top-right corner of Figure 9) is selected because of its high intelligence and automatic evaluability.
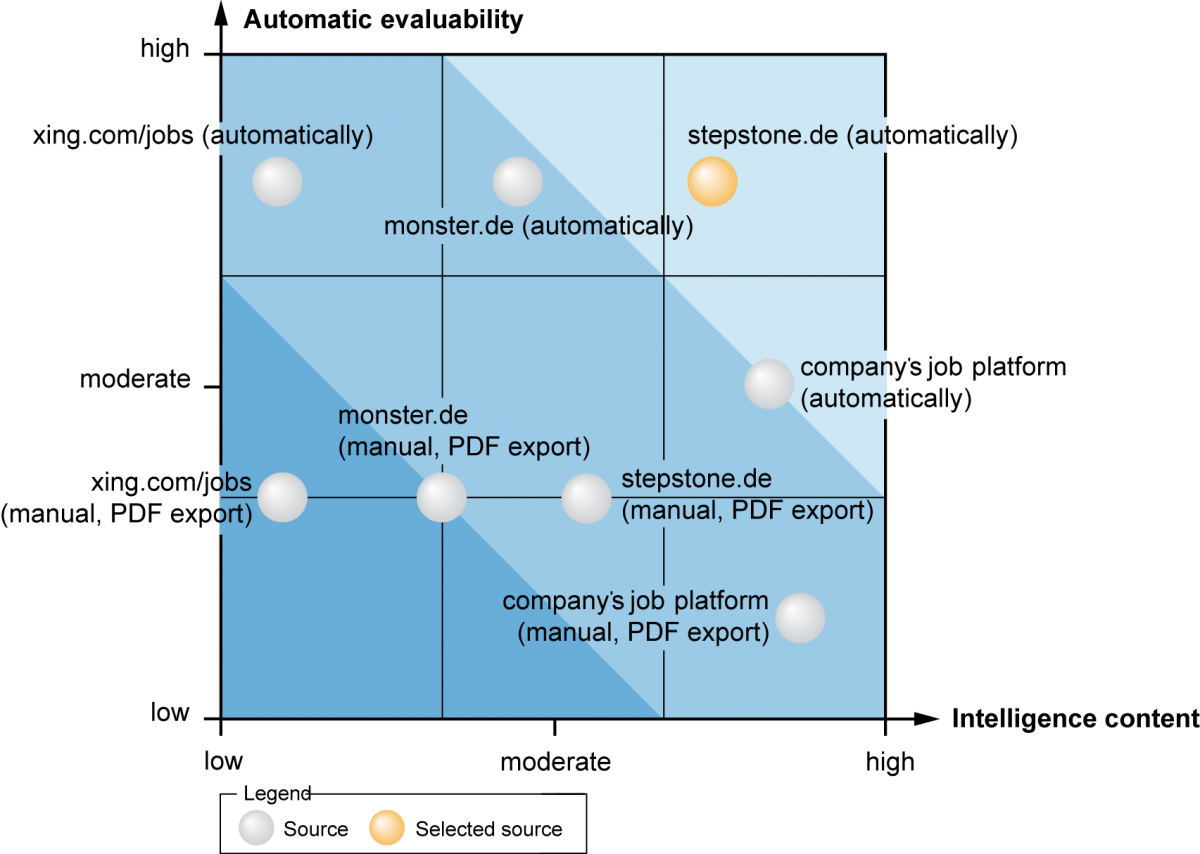
Figure 9. Scoring of potential sources of intelligence on competitor's human capital (via current vacancies)
The actual investigation of a participant's stock of IP is undertaken by text and data mining, for example using an open source tool such as KNIME. Such tools allow a company to identify relevant words and important patterns in a set of files (e.g., PDF files or webpages of job vacancies), and automated workflows can be created to repeatedly visit and parse particular websites.
Phase 3.2: Definition of the search query
The next step is to consider the search query. Sources usually offer a search field where a user can insert one or more words to filter potentially relevant information, such as vacancies in online job platforms. The recommended practice is just to filter for the name of the participants in the competitive arena and all relevant intelligence using a text and data mining tool. For participants who offer specific sources, such a competitor's an own online job platform, all vacancies should be extracted. The collected intelligence is filtered afterwards with a consistent search query in KNIME.
To specify a search query, the aim is to develop a list of terms that relate to the different technology fields selected in Phase 1 and that correspond to the different components of each type of intellectual capital.
Phase 3.3: Scoring of the stock of IP of participants in the competitive arena
The next step is to score each relevant participant in the competitive arena concerning their stock of IP. For competitors, three different considerations are evaluated: static, dynamic, and linking. The static consideration refers to the absolute build-up of the stock of IP in one technology field. The dynamic consideration refers to the period over which the build-up of the stock of IP in one technology field takes place. The linking consideration refers to the endeavours of participants to build up the stock of IP in a combination of more than one technology field.
For the example, in the context of job vacancies, appropriate aspects to score are the absolute number of current vacancies and the concretization of the technology field in the vacancy description: for example, whether the vacancy descriptions refer to a research cooperation or funding project, whether the number of vacancies for a specific technology field is increasing or decreasing, etc. Moreover, the endeavours of a competitor to link more than one technology field together (e.g., linking additive manufacturing and advanced materials). These different aspects of the "vacancies" component of human capital are scored as are the other components of human capital, such as "knowledge" (Figure 8). However, each aspect can be weighted differently.
Furthermore, for the other participants in the competitive arena (e.g., technology suppliers and others such as research institutes), the different aspects of Phase 3 must be considered differently. For example, the lists of search terms have to be adapted – in this context, it might be more relevant for a medical-technology company to investigate whether a specific technology supplier searches for employees in the medical sector. In this case, the list of search terms should contain medical-orientated terms such as "invasive" or "noninvasive".
At the end of Phase 3, a multidimensional vector with percentage values of [structural; human; customer] capital defines each participant in the competitive arena.
Phase 4: Display of the stock of IP of participants in the competitive arena
To display the stock of IP of the different participants in the competitive arena, a zoomed version of the bubble chart, shown in Figure 4, is created. Figure 10 shows the top right corner of this chart with the three technologies additive manufacturing, energy storage, and advanced materials.
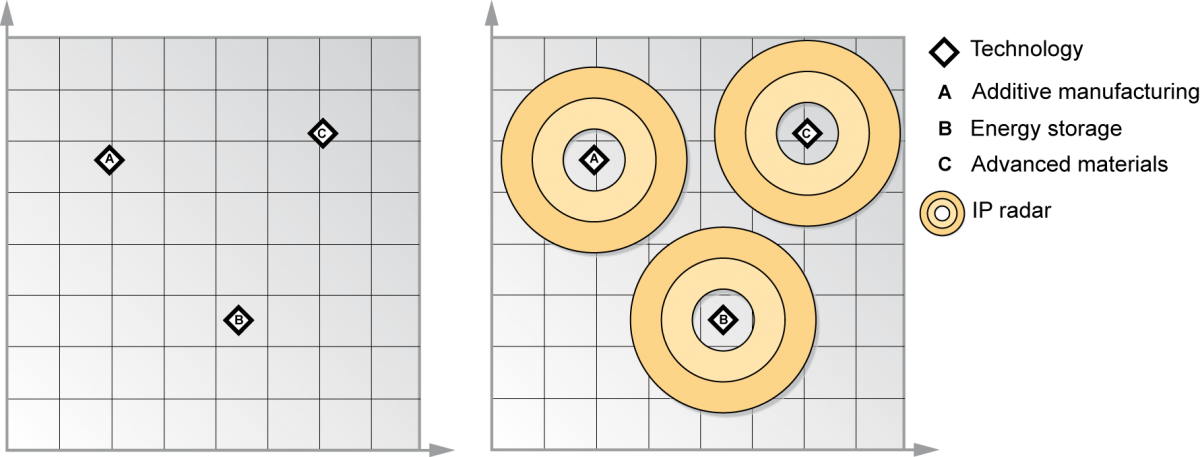
Figure 10. Raw IP-technology landscape without (left) and with IP radar (right)
Around each technology field, an IP radar is drawn (Figure 10, right). The IP radar is the presentation level for the evaluation results. Each participant in the competitive arena is sorted in the radar by its multidimensional vector. Each participant of each group in the competitive arena is arranged in the radar in relation to each other. The different groups in the competitive arena can be added in layers. For example, layer 1 can show the stock of IP of the different relevant competitors, layer 2 can show the stock of IP of technology suppliers, and layer 3 can show the stock of IP of other participants. Figure 11 shows a filled-in IP-technology landscape. The positions of the triangles, circles, and rectangles describe the quantity of IP held by the participant organization (whether competitor, technology supplier, or other). The closer a symbol moves to the middle of the IP radar, the higher the quantity of IP. Organizations that are not shown on the IP radar do not have IP around the technology field (or it is not identifiable from outside). Symbols close together have a very similar structure of IP.
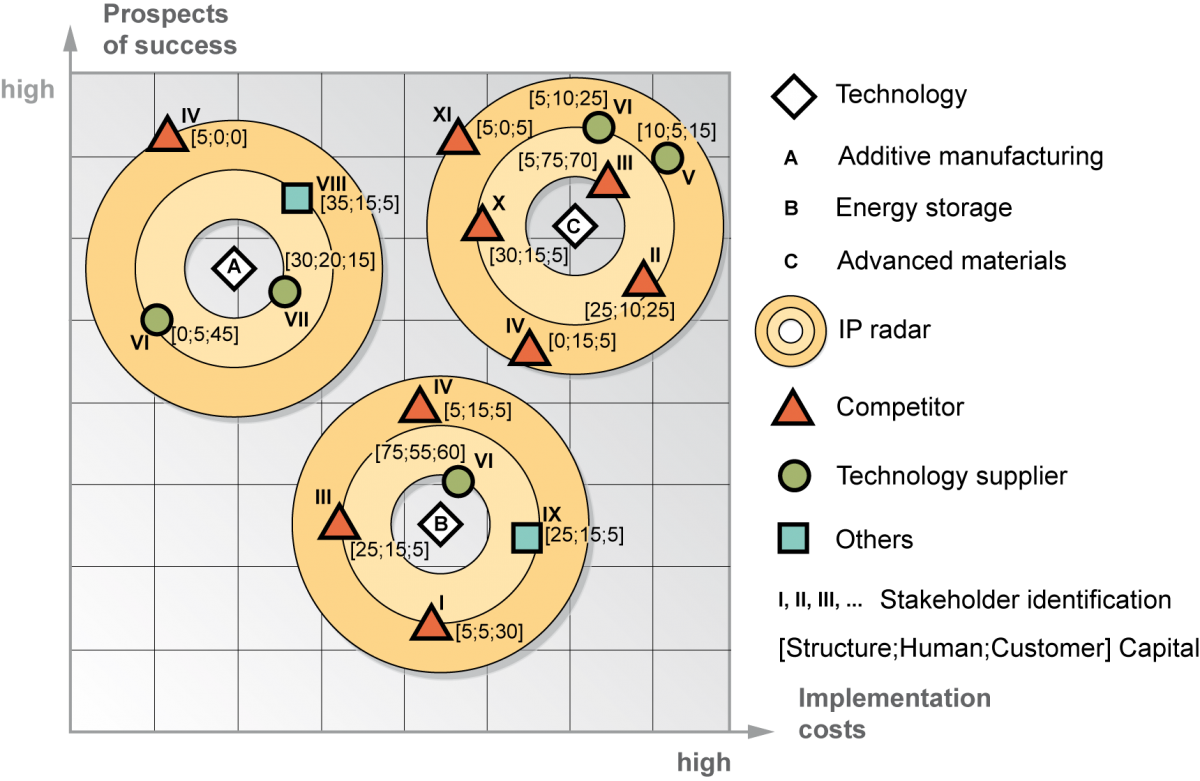
Figure 11. Example IP-technology landscape
Phase 5: Decision support
The filled-in IP-technology landscape is used to provide a clear description of the competitive arena. This visualization makes it clearly evident which participant in the competitive arena deals with which technology field(s) and what stock of IP it has in every (monitored) technology field. The greater the distance between the participants, the greater the difference in the value of the vector. The closer a participant in the competitive arena is arranged towards the heart of a specific technology field, the more important the participant is. The interpretation of the importance depends on the group in the competitive arena. The closer a competitor is located to the heart of a technology field, the higher its potential threat on the technological development of the company. Therefore, the landscape enables the company to detect which technology field is sparsely covered with IP from participants in the competitive arena (fundamentally, the IP of competitors) – in other words, the methodology is ideal for detecting white spots.
For the groups of technological suppliers and others (such as research institutes), the landscape must be interpreted as follows: the closer the participant is located to the heart of the technology field, the greater the benefit of a potential cooperation. Therefore, the landscape can be used to identify the most beneficial cooperation partners.
Regular iterations of Phases 2 to 5 enable the company to detect temporal changes in the stock of IP of participants in the competitive arena. New participants may appear on the IP-technology landscape while the position of existing participants may change.
Taking strategic action
Once the analysis is complete, the final step is to develop a strategy. Figure 12 shows how the interpretation of the IP-technology landscape is combined with an evaluation of the technology fields concerning the value proposition. The latter refers to the question of how important the investigated technology fields are regarding to the value proposition of a product field – we describe this as business importance. Four characteristic areas of the bubble chart lead to the following recommended strategies with regards to the technology fields positioned in each area:
- Fight with the gloves off: Technology fields that are placed top right are very important for the company's own business. But many competitors and technology suppliers are building up IP or they may even have IP in this field. For this reason, the company has to gain IP as soon as possible or aspire to other strategies such as cross licensing.
- Retreat: Technology fields that are placed top left are less important for the company's own business and the competitive intensity around this technology is high. Any effort to build up or secure the IP is not worth the trouble.
- Trade-off: Technology fields that are placed bottom left are less important and the competitive intensity is low. The company has to decide if they want to spend money and time for IP in these fields.
- Leadership: Technology fields that are placed bottom right are most important for strategic planning. The business importance is high and the competitive intensity is low. Spending resources for IP in technology fields in this area can give the company a high competitive advantage. The strategy is to invest resources in these fields.
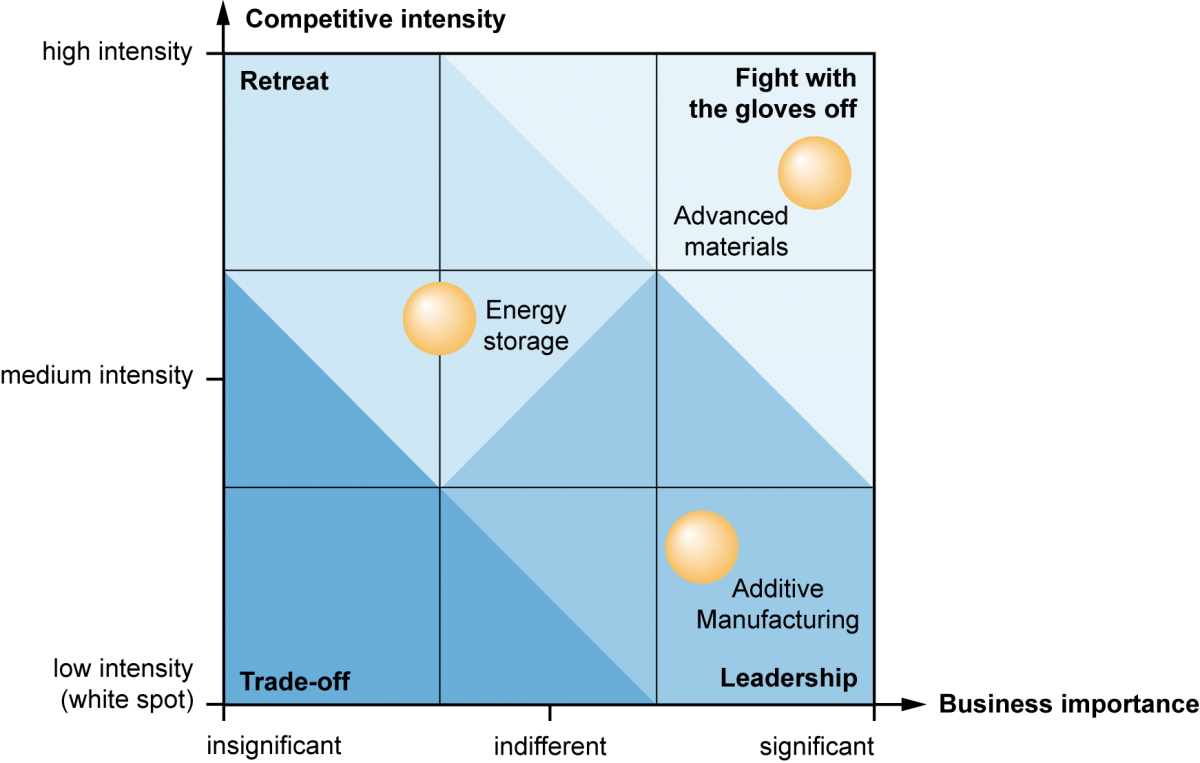
Figure 12. Recommended strategies based on positioning of technology fields
Conclusion
We are experiencing a time of opportunities. The digitization of the economy will substantially change the way we live and work, and new players will position themselves in the competitive arena. Against this background, a forward-looking approach is of special importance for long-established companies. Weak signals provide important information for the future-oriented design of companies. The Internet is a useful tool to detect these signals over time. However, we are still missing methods to use this instrument smartly. In this article, we present a way how such weak signals can be systematically and easily identified using IP as an access point to this goal. But the approach considers not only patents and trademarks. We also consider human, structural, and customer capital. As a result, we can detect white spots that represent technological directions for the design of the innovation strategy. Strategic actions within these white spots can create competitive advantages and ensures the survival of the company in a dynamic market.
At the core of the method, we use text mining. Text mining is already used successfully in many disciplines. It is a powerful tool to find the intelligence in a huge amount of data, and the volume of assessable data will increase in the future. Companies will be well-advised to extract more information from this data than their competitors. Our approach will enable them to detect the IP activities of different stakeholders in order to improve their innovation strategy. Based on the presented procedure, recommendations for the development of IP were presented. In further research, it will be necessary to expand the IP indicators and the implementation of the recommendations.
Acknowledgements
An earlier version of this article was presented at the 2016 ISPIM Innovation Forum in Boston, United States of America, March 13–16. ISPIM – the International Society for Professional Innovation Management – is a network of researchers, industrialists, consultants, and public bodies who share an interest in innovation management.
References
Alwert, K., Bornemann, M., Will, M., & Wisher, S. 2013. Wissensbilanz – Made in Germany: Leitfaden 2.0 zur Erstellung einer Wissensbilanz. Berlin: Bundesministerium für Wirtschaft und Technologie (BMWi).
Deltl, J. 2011. Strategische Wettbewerbsbeobachtung – So sind Sie Ihren Konkurrenten laufend einen Schritt voraus (2nd Ed.). Wiesbaden: Gabler-Verlag Springer Fachmedien.
Echterhoff, N. 2014. Systematik zur Planung von Cross-Industry-Innovationen. Band 332. Ph.D. Dissertation. Paderborn: University of Paderborn, HNI-Verlagsschriftenreihe.
Eckelt, D., & Gausemeier, J. 2015. Vorsprung durch strategisches IP-Management: Geistiges Eigentum kennen, schützen und nutzen. IP: Kooperation, Wettbewerb, Konfrontation, 37. Kolloquium der TU Ilmenau über Patentinformationen, Band 37, June 10–12, 2015, Technische Universität Ilmenau and PATON - Landespatentzentrum Thüringen.
Eckelt, D., Gausemeier J., & Peter, S. 2014. Ganzheitliches Produktschutzmanagement: Vorgehen zur Entwicklung zukunftsrobuster Schutzkonzeptionen: 333–334. 10. Symposium für Vorausschau und Technologieplanung 334.
Gartner. 2015. Gartner's 2015 Hype Cycle for Emerging Technologies. Gartner: August 18, 2015. Accessed December 1, 2015:
http://www.gartner.com/newsroom/id/3114217
Gausemeier, J., & Plass, C. 2014. Zukunftsorientierte Unternehmensgestaltung – Strategien, Geschäftsprozesse und IT-Systeme von morgen. Munich: Carl Hanser Verlag.
Gausemeier, J., Glatz, R., & Lindemann, U. 2012. Präventiver Produktschutz. Munich: Carl Hanser Verlag.
Kneisel, E., Rößl, C., & Pawlowski, P. 2012. Meilensteine der IC-Entwicklung. In P. Pawlowsky & L. Edvinsson (Eds.), Intellektuelles Kapital und Wettbewerbsfähigkeit - Eine Bestandsaufnahme zu Theorie und Praxis: 39–65. Wiesbaden: Springer Gabler.
Lange, V. 1994. Technologische Konkurrenzanalyse – zur Früherkennung von Wettbewerberin-novationen bei deutschen Großunternehmen. Wiesbaden: Springer Fachmedien.
Lindgardt, Z., Reeves, M., Stalk, G., & Deimler, M. S. 2013. Business Model Innovation – When the Game Gets Tough, Change the Game: 1–3. Boston: The Boston Consulting Group.
Manchanda, P., Packard, G., & Pattabhiramaiah, A., 2015. Social Dollars: The Economic Impact of Customer Participation in a Firm-sponsored Online Customer Community. Marketing Science Volume, 34(3): 367–387.
http://dx.doi.org/10.1287/mksc.2014.0890
McKinsey Global Institute. 2015. Disruptive Technologies: Advances that Will Transform Life, Business, and the Global Economy. McKinsey Global Institute.
http://www.mckinsey.com/business-functions/business-technology/our-insig...
Meinwald, T. 2011. Konzepte zum Schutz vor Produktpiraterie und unerwünschtem Know-how-Abfluss. Ph.D. Dissertation. Munich: Technical University of Munich.
Michaeli, R. 2006. Competitive Intelligence: Strategische Wettbewerbsvorteile erzielen durch systematische Konkurrenz-, Markt- und Technologieanalysen. Berlin: Springer Verlag.
Mittelstaedt, A. 2009. Strategisches IP Management – mehr als nur Patente. Wiesbaden: Gabler Verlag.
Mitelstaed, A. 2016. Intellectual Property Management – Geistiges Eigentum als Führungs-instrument und Erfolgsfaktor in der Wissensökonomie. Wiesbaden: Springer Fachmedien.
Nagel, C. 2012. Intellectual Capital Ansätze in Unternehmen – Erfahrungen aus der Praxis. P. Pawlowsky & L. Edvinsson (Eds.), Intellektuelles Kapital und Wettbewerbsfähigkeit - Eine Bestandsaufnahme zu Theorie und Praxis: 69–71. Wiesbaden: Springer Gabler.
Osterwalder, A., Pigneur, Y., Bernarda, G., & Smith, A. 2014. Value Proposition Design: How to Create Products and Services Customers Want. New Jersey: John Wiley & Sons.
Peitz, C. 2015. Systematik zur Entwicklung einer produktlebenszyklusorientierten Geschäftsmodell-Roadmap. Ph.D. Dissertation. Paderborn: University of Paderborn, HNI-Verlagsschriftenreihe, Band 337.
Siemens. 2015. Pictures of the Future. Siemens. Accessed December 1, 2015:
http://www.siemens.com/innovation/de/home/pictures-of-the-future.html
Sonneck, M. 2014. Patente als strategisches Wettbewerbsinstrument. MaschinenMarkt, 1/2: 18–19
Stewart, T. A. 1997. Intellectual Capital – The New Wealth of Organizations. New York: Doubleday.
Taylor, A., & Wagner, K. 2014. Rethinking Your Innovation System. Boston: The Boston Consulting Group.
The Economist. 2015. Does Deutschland Do Digital? The Economist: November 21, 2015. Accessed December 1, 2015:
http://www.economist.com/printedition/2015-11-21
Wagner, K., Taylor, A., Zablit, H., & Foo, E. 2013. The Most Innovative Companies 2013: Lessons from Leaders. Boston: The Boston Consulting Group.
Walde, P. 2016. Digital Intelligence – Möglichkeiten und Umsetzung einer informatikgestützten Frühaufklärung. Dissertation. Leipzig, Germany: Der Fakultät für Mathematik und Informatik der Universität Leipzig eingereichte.
Wellensiek, M., Schuh, G., Hacker, P. A., & Saxler, J. 2011. Technologiefrüherkennung. In G. Schuh & S. Klappert (Eds.), Technologiemanagement – Handbuch Produktion und Management 2: 89–100. Berlin: Springer-Verlag.
Wurzer, A., & Berres, W. 2011. Mit IP-Management die Innovationskraft stärken. VentureCapital Magazin, 4: 38–39.
Wurzer, A., & Schäffner, K. 2015. Patente Küchenmaschine. Harvard Business Manager, August: 59-63.
Zeller, A. 2003. Technologiefrühaufklärung mit Data Mining. Wiesbaden: Deutscher Universitäts-Verlag/GWV Fachverlage.
Zollenkop, M. 2006. Geschäftsmodellinnovation. Wiesbaden: Deutscher Universitäts-Verlag and GWV Fachverlage.
Keywords: business model, competitive advantage, competitive arena, Innovation management, intellectual capital, intellectual property, value proposition