AbstractNot everything that can be counted counts, and not everything that counts can be counted.
William Bruce Cameron
In Informal Sociology: A Casual Introduction to Sociological Thinking (1963)(This quotation was used frequently during the workshops in this study.)
Numerous established companies look for ways to rejuvenate their innovation capabilities, as it is essential for their long-term survival. One way is through the development of key performance indicators (KPIs) to measure innovation success. However, the wrong performance measurement approach can hinder innovation efforts. This case study explores the steps and challenges associated with the development of innovation KPIs in an established execution-oriented manufacturing company. Three prerequisites are proposed for such a project in a similar context: 1) a minimal maturity level of innovation processes, 2) strategic alignment, and 3) commitment to innovation. It is also proposed that, in such an execution-oriented company, it might be more effective to start with KPIs that would encourage behaviours more favourable to innovation. Then, with stronger innovation capabilities, it will be easier to develop appropriate KPIs to measure the success of innovation endeavours.
Introduction
When they grow and become more established, companies tend to lose their innovation capabilities while focusing on the execution of everyday routines. In this article, we refer to such companies as execution-oriented, where “execution” refers mainly to short-term actions as opposed to long-term, systemic, and strategic thinking” (Lakiza, 2018). Such a company is risk averse and focuses on delivering tangible outputs without ensuring that the resources spent are contributing to the company’s high-level objectives. This approach is not compatible with strong innovation capabilities, which are defined by Olsson and colleagues (2010) as the “ability to continuously develop innovations as a response to a changing environment”.
In the context of increasingly shorter company lifespans (Morris, 2009), the loss of innovation capabilities becomes a significant problem for established firms, which lose market share to more innovative players. This was one of the challenges faced by a 60-year-old family-owned Canadian manufacturer (hereafter “the company”) when our research group began its longitudinal research on innovation management practices based out of their head offices.
The starting assumption of this longitudinal research was that the performance measurement systems in place have an influence on the company’s innovation capabilities (Christensen, 1997; Perez-Freije & Enkel, 2007; Pinchot III, 1985; Ries, 2011). Hence, a development project focused on innovation key performance indicators (KPIs) was seen by the Company as one way to support the development of their innovation capabilities. It was led by the first author of this paper as one of seven projects within a portfolio of longitudinal action research supervised by the second author.
Two key questions driving this research are:
- What kind of indicators are more appropriate for innovation?
- How they can be used to support and improve a company’s innovation capabilities?
Indeed, according to Saunila (2016), there is a lack of literature on the role of performance measurement in developing innovation capabilities. Although some companies do not measure their innovation performance, many of those who measure it do not know how to choose the appropriate metrics and systems. Ill-suited indicators can result in inhibiting a company’s innovation capabilities instead of supporting them (Christensen, 1997). Thus, the core interest behind this case study is to better understand how an established company can rejuvenate its innovation capabilities through the development of innovation KPIs.
This article is structured as follows. First, we present the case study context. Next, we share an overview of relevant innovation measurement theories. Then, we detail the research methodology and the case study steps, along with the proposed innovation KPIs. We then describe the biggest challenges met throughout the KPI development project. Finally, we conclude the article with recommendations regarding some prerequisites of innovation KPI implementation for similar contexts.
Case Study Context
In this section, the research context is presented, followed by a quick overview of the company and its existing performance measurement systems before our intervention.
Research context
Our longitudinal action research involved a total of 7 field researchers over three years. Each of them was present for 8 to 12 months at the case company and had a dual mandate:
- Exploration of a specific research theme related to innovation management and analysis of the company’s status with regards to this theme.
- Execution of a specific mandate for the company by transferring and implementing best practices from literature to improve their innovation capabilities with regards to the research theme.
The present case study is based mainly on the work of the first author on innovation performance measurement systems. The company asked the researcher to help develop KPIs to measure the overall performance of all types of their technical innovation projects.
For the purposes of this action research, the researcher worked as an integral part of the recently formed Innovation, Research & Development and Technology (IRDT) group within the company’s engineering department. The technical innovation performance under study included new product development projects, innovation on customer orders, and new technology development. These covered anything from minor incremental improvements on existing products to “new to the world” products. The management of the IRDT group saw the development of innovation KPIs as a way to legitimize and improve the visibility of the innovation management practices being implemented.
Case company
The company is a Canadian specialized manufacturer that counts almost 2000 employees in North America and Europe. It was founded in the 1950s by an inventor and entrepreneur. As it is often the case in companies founded on a single technological innovation (McAdam & Keogh, 2004), the founder was an engineer with multiple patents to his credit but lacking some of the specific knowledge and skills necessary to develop within his company what Wolpert (2002) describes as “exploration competencies”. With the high power concentration in the founding family’s hands for decades, the company did not build solid management capacity nor key elements of an innovative company culture such as decision making and accountability (Rao & Weintraub, 2013).
The founder remained at the head of the company until the early 2000s and continued to be its main driving force of innovation for several more years. As in a typical family business generational model (Hiebl, 2015), the second generation focused more on operations optimization and acquisitions; the third generation, which recently began to access upper management positions, is trying to rejuvenate the company’s innovation capabilities (Brodeur et al., 2017).
During the presence of our research group on site, the company hired its first non-family member President and CEO. He joined the Company after major operational issues started to affect its overall performance and high-quality reputation due to significant delivery delays. The new CEO took on the challenge of fixing these operational issues.
Existing performance measurement systems
During the second year of our longitudinal research, each department (engineering, marketing, sales, and operations) had its own data management system. However, there were few links and little transversal communication between the systems and the departments. Few employees had access to any system from other departments. Moreover, the main data management systems (engineering and sales) had been built mostly in-house throughout the years, and their usage was far from intuitive for someone new or from a different department.
The new CEO developed a new scorecard to measure the company’s performance. Most of the high-level KPIs chosen were short-term financial metrics, with none regarding innovation, as illustrated in Table 1. The VPs received the mandate to cascade down the new company goals and KPIs. Few, however, seemed to know how to approach this task.
Table 1. The case company’s executive scorecard
|
Category |
KPI |
Description |
|
Financial Performance |
Past Due |
Value of orders past due [$] |
|
Turns |
# of annual inventory turns |
|
|
Material Savings |
Procurement savings relative to average price in previous year [$] |
|
|
Anchor Bookings |
Bookings for anchor products [$] |
|
|
Spares Billings |
Billings for spare parts [$] |
|
|
Delivery |
Supplier on-time-delivery (OTD) |
Supplier OTD by receiving line with 0 days grace |
|
Project OTD |
Project OTD by order line with 0 days grace |
|
|
Quality |
Rework Cost |
Rework Cost as a fraction of value-added labour [$] |
|
First Test Fail |
# of failures related to # of products tested |
|
|
Safety |
Total Recordable Cases |
# of Total Global Recordable Cases per 200,000 hours |
Moreover, an effort to develop and implement indicators to measure the success of new product development projects only, was undertaken by the company’s innovation management team during the first year of our research (i.e., before the case study presented here) and therefore was done without the participation of our research team. As part of that effort, a brainstorming session with innovation stakeholders on what is possible to measure resulted in a list of 38 indicators, presented in Table 2. This initial step was followed by an assessment of which indicators were measurable with the existing data management systems, which eliminated 14 indicators that were too difficult to collect (in bold in Table 2). The innovation management team found that different stakeholders were interested in different indicators. The company began to collect the remaining 24 metrics monthly and to share them with the relevant stakeholders. However, no specific goals were attached to most of these indicators, and they were not strategically related to the executive scorecard presented in Table 1. The chosen indicators were associated with one of three phases: 1) Front-End of Innovation (FEI), 2) Product Development Process (PDP), or 3) Post PDP. They were a mix of financial, operational, process, and portfolio indicators as categorized in Table 2. The 14 indicators that were not implemented seemed like the most important ones to the IRDT group. However, there were no resources available to work with the relevant departments in order to implement these indicators.
Table 2. New product development performance indicators developed prior to our innovation KPI mandate
|
Category |
FEI |
PDP |
Post-PDP |
|
Financial |
|
|
|
|
Operational |
|
|
|
|
Process |
|
|
|
|
Portfolio |
|
|
|
Innovation Measurement Theories and Their Applicability
Performance measurement is necessary to be able to detect poor performance and take appropriate actions towards improvement (Godener & Soderquist, 2004). While some authors believe that control systems and performance measurement systems can hinder employee creativity and intrapreneurial efforts (Christensen, 1997; Morris & Kuratko, 2002; Pinchot III, 1985; Shih & Yong, 2001), others think that they can contribute to higher innovation effectiveness by providing guidance and highlighting where improvement is possible (Cooper & Edgett, 1996; Griffin, 1997; Hart et al., 2003; Jiménez-Zarco et al., 2006; Marginson, 2002; Neely et al., 2000; Neely et al., 1997). This section provides a quick overview of the history of performance measurement systems, as well as a short literature review on such systems specifically related to measuring innovation. The main functions and usages of performance measurement systems are also discussed and followed by a few guiding principles for their effectiveness.
History of performance measurement systems
Historically, performance measurement systems used to be under the finance function, had mostly financial metrics, and used data from accounting and finance (Bremser & Barsky, 2004; Neely et al., 2000; Neely et al., 1997). However, this approach provided limited diagnostic power and forced a short-term orientation, eventually resulting in a demand for more balanced performance indicators with measures of customer satisfaction and human capital (Jiménez-Zarco et al., 2006).
More balanced performance measurement systems covering different performance perspectives were developed to address this need. These included the Balanced Scorecard (Kaplan & Norton, 1992) and the Performance Pyramid Prism (Lynch & Cross, 1991). Such models focus on strategic alignment and facilitate translating strategy into action (Garengo et al., 2005). While a number of authors believe that the Balanced Scorecard can be used for innovation performance measurement (Bremser & Barsky, 2004; Kerssens-van Drongelen & Bilderbeek, 1999; Kerssens-van Drongelen et al., 2000), others think it is too complex to implement and not appropriate for this context (Garengo et al., 2005; McAdam, 2000; Oriot & Misiaszek, 2012).
Garengo and colleagues (2005) found that a focus on stakeholders has become one of the key dimensions of models for contemporary performance measurement systems. According to Kaplan and Norton (1996), customers’ concerns generally fall under time, quality, performance, and cost. Knowledge of stakeholders’ expectations and attention to their needs is essential for a company to thrive (Atkinson et al., 1997; Neely et al., 2002), especially in highly uncertain contexts characteristic of innovation (Dewangan & Godse, 2014). In their study on the effectiveness of R&D performance measurement in the Netherlands, Kerssens-van Drongelen and Bilderbeek (1999) found that customer focus might be the most important characteristic that distinguishes effective performance measurement systems. Storey and Kelly (2001) claim that, from a customer point of view, a successful new product satisfies new needs or desires and outperforms other products. According to a survey of practitioners by Griffin and Page (1993), while many would like to measure customer satisfaction (44%), very few do (10%) as it usually incurs additional costs.
Innovation performance measurement systems
Innovation performance measurement brings additional challenges given its dynamic and evolving nature (Kirchhoff et al., 2013). While the financial metrics are the most popular, there is no consensus among researchers (Jiménez-Zarco et al., 2006) or practitioners (Griffin & Page, 1993) on the most useful innovation KPIs. According to Werner and Souder (1997), who reviewed 40 years of literature, the most complex metrics are often the most useful. They are also the most costly to develop and use.
Following a survey of practitioners, Griffin and Page (1993) found a gap between the measures used and those that the managers would like to use. They also found that the most innovative firms focus on measures of recent and future company growth while the least innovative ones prefer more efficiency-oriented metrics (Griffin & Page, 1996). According to Hitt and colleagues (1996), the most innovative companies focus more on strategic controls than on the financial ones. Storey and Kelly (2001) also found that the truly innovative firms favour soft indicators while the least innovative ones focus on financial metrics.
Through decades of research, it has been difficult to achieve a common understanding and provide clear recommendations to managers on innovation management and decision making because of the inherent variance of innovation and its context specificity (Brophey et al., 2013; Vorbach & Perl, 2007). The appropriate success metrics depend on the type and context of the project (Petersen et al., 2010). Indeed, some case study research highlights the fact that the uniqueness of each innovation context makes comparisons and generic best practices impracticable (Bremser & Barsky, 2004; Brophey et al., 2013; Brophey & Brown, 2009; Godener & Soderquist, 2004; Griffin & Page, 1996; Jiménez-Zarco et al., 2006). Consequently, the perfect KPIs probably do not exist. It is more worthwhile to look for guidelines on how to choose appropriate metrics and systems based on various contextual factors.
Functions and usage of performance measurement systems
Innovation performance measurement is idiosyncratic for each company at a given point in time and for each type of innovation project (Bremser & Barsky, 2004; Brophey et al., 2013; Brophey & Brown, 2009; Godener & Soderquist, 2004; Griffin & Page, 1996; Jiménez-Zarco et al., 2006). It is important to understand the reasons why there is a need to measure performance and what is the intended use of the data, before looking into what to measure (Ojanen & Vuola, 2005; Perez-Freije & Enkel, 2007).
Kerssens-van Drongelen (1999) identified the seven following functions of a performance measurement system:
- Provide insight into deviations of performance from objectives to allow management to decide if steering measures are necessary
- Provide insight into deviations of performance from objectives to allow staff to decide if steering measures are necessary
- Fuel learning on the system that is being controlled to enable better planning and control in the future
- Facilitate alignment and control of objectives
- Support decision making with regards to performance-based rewards
- Provide input to support and justify decision making
- Motivate employees through feedback
Godener and Soderquist (2004) examined the literature and regrouped the possible uses of performance measurement for R&D and new product development into five categories:
- Communication of objectives, agreements and rules
- Definition of corrective actions based on diagnosis and control
- Resource allocation
- Decision making on individual rewards and incentives
- Learning and continuous improvement
From a different perspective, Cirka (1997) groups control strategies into three categories based on what they do: 1) regulate the organization’s inputs, 2) govern employees’ behaviours, or 3) measure achievement and outputs.
Guiding principles for an effective performance measurement system
Based on a study of the literature of performance measurement systems for innovation, Dewangan and Godse (2014) propose five guiding principles for an effective performance measurement scheme, arguing that it must:
- Be multi-dimensional
- Measure performance of various stages within the innovation cycle
- Address organizational stakeholder goals
- Support a cause-and-effect relationship
- Be easy to implement and use (aligned with existing performance measurement systems and cascaded through various hierarchical levels)
According to Bremser and Barsky (2004), properly selected metrics should be drivers of sustained profitability. To do so, the firm should develop a set of hypothesized cause-and-effect relationships that show the expected long-term results from specific current actions (Bremser & Barsky, 2004). Over time, the hypotheses can be verified and adjusted if proven wrong. Finally, Collins and Smith (1999) believe that there has to be a balance between leading, lagging, real-time, and learning indicators.
Summary of insights from literature with regards to our case study
There is no consensus in either the literature or practice on the appropriate KPIs to use for innovation performance measurement (Griffin & Page, 1993; Jiménez-Zarco et al., 2006). Nevertheless, the literature review allowed for the identification of several common characteristics of performance measurement systems that are more conducive to innovation, as presented in Table 3. Based on our analysis of the company’s context, these characteristics did not apply to the company’s performance measurement systems at the time of study and were used to guide our propositions.
Indeed, the case company’s performance measurement systems are not balanced as they are mostly financial and have a significant lack of customer-based metrics. Success from a customer point of view is difficult to define as there are no efficient feedback loops between the company and its customers. In addition, there is little alignment between their executive scorecard and the one for new product development, notably because innovation is not part of the executive scorecard.
Moreover, the case company favours easy and accessible efficiency-oriented metrics. However, when asked about what really needs to be measured, the stakeholders are interested in intangible indicators that are difficult to measure, but they do not invest the resources necessary to develop the appropriate measurement systems. This is typical of the least innovative firms according to both Griffin and Page (1996) and Storey and Kelly (2001).
Table 3. Characteristics of performance measurement systems favourable to innovation (reproduced from Lakiza, 2018)
|
Characteristics |
References |
|
Encouragement of initiative taking |
Jiménez-Zarco et al. (2006) |
|
Focus on intangible aspects |
Dewangan & Godse (2014); Gama et al. (2007); Kaplan & Norton (2001); Rao & Weintraub (2013) |
|
Focus on objectives as opposed to results |
Kaplan & Norton (1992) |
|
Measurement of employee learning and continuous development |
Dewangan & Godse (2014); Jiménez-Zarco et al. (2006); Kaplan & Norton (1992); Ries (2011) |
|
Focus on forecasting future processes as opposed to controlling past activities |
Bremser & Barsky (2004); Garengo et al. (2005); Jiménez-Zarco et al. (2006); Kaplan & Norton (1992) |
|
Dynamic and flexible |
Marginson (2002); McAdam & Keogh (2004); Morris & Kuratko (2002); Neely et al. (2000) |
|
Informal and loose |
Covin & Slevin (1991); Morris et al. (2006); Morris & Kuratko (2002); Pinchot III (1985) |
|
Focus on strategy and vision as opposed to finance and controls |
Garengo et al. (2005); Hitt et al. (1996); Kaplan & Norton (1992) |
Several authors agree that innovation performance measurement is idiosyncratic to each company’s specific context (Brophey et al., 2013). Consequently, some authors propose guidelines on how to choose the appropriate metrics for each case (Dewangan & Godse, 2014). Finally, it is important to determine the intended use of performance measurement in order to choose suitable indicators (Ojanen & Vuola, 2005; Perez-Freije & Enkel, 2007).
Innovation KPI Development at the Case Company
The objective of the researcher’s mandate was to develop a set of three to five simple but comprehensive KPIs to assess the performance of technological innovation and to evaluate the contribution of the IRDT team to the company’s overall performance. The KPIs were meant to cover new product development, innovation on customer orders, and technology development. Below, we present a brief overview of the researcher’s general methodology before diving into the key steps taken in the development of the innovation KPIs.
Research methodology
The central interest of this study was to better understand how organizational change unfolds in practice. Research design choices, as presented in Figure 1 were made to achieve this goal. Although some general research steps were planned, the multiple data collection methods presented in Figure 1 were used mostly iteratively, adapting to new questions and opportunities arising as the research unfolded.
Although not all the research data collection methods were directly associated with the KPI development mandate, the resulting observations also contributed to the thinking on the most appropriate innovation KPIs.
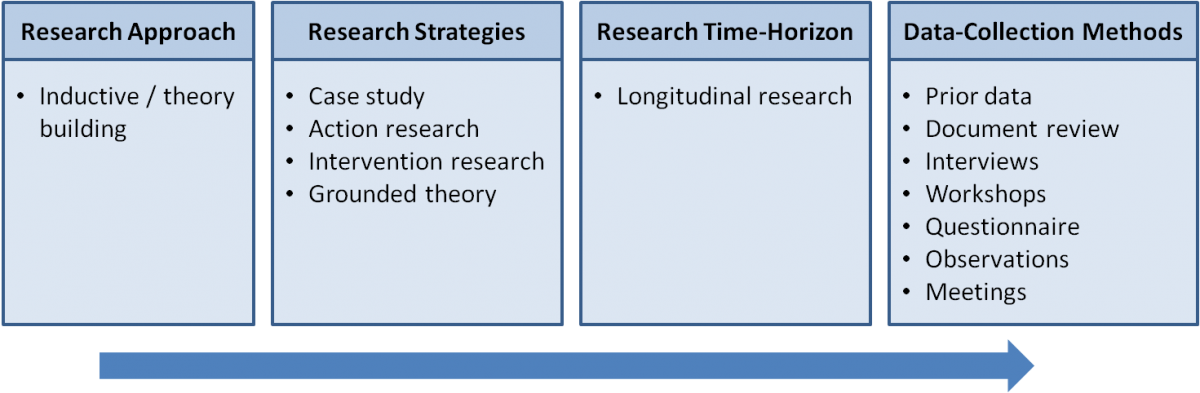
Figure 1. Research design choices
KPI development steps
Figure 2 presents the general process flow of the innovation KPI development mandate within the case company. Some of the key high-level steps are described in greater detail below.
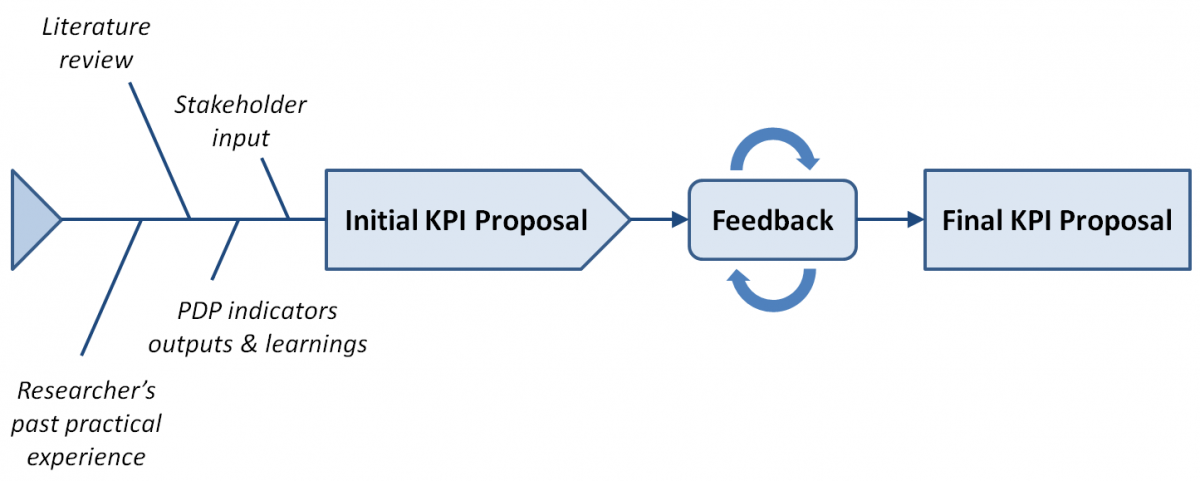
Figure 2. Process flow for developing innovation KPIs
Stakeholder input
At the beginning of our mandate, we met the internal innovation stakeholders in order to outline the project’s scope, describe the researcher’s role, understand their expectations, and build trust (Patton, 1987). A total of 16 interviews were carried out with stakeholders from the Engineering, Marketing, Sales, and IT & Strategy departments. External company stakeholders were not involved in this mandate, primarily because of the general lack of external input in the company’s activities, as explained later. The project-scope interviews identified a clear need to bridge the gap between different stakeholders’ views on innovation and their measurement needs. Therefore, a participatory workshop was developed to build shared understanding through discussions among key stakeholders on their main expectations and needs for measurement. The aim was to achieve a common view on the most important aspects to be measured.
First, the participants were asked to share what functions of performance measurement systems (Kerssens-van Drongelen, 1999) they were looking for and how they would like to use the future innovation KPIs (Godener & Soderquist, 2004). This input helped the stakeholders focus on what matters to them, instead of choosing some existing popular metrics without ensuring their usefulness.
Further questions helped explore what successful innovation meant to the participants. This step contributed to the sharing of different views on the subject so as to start building a common understanding on how they want success to look for the company’s projects.
The alignment of innovation activities with corporate strategy is judged by many as essential (Bremser & Barsky, 2004; Jiménez-Zarco et al., 2006; Kuratko et al., 2014). Moreover, senior management involvement is crucial in order to ensure successful implementation and overall alignment of key measures within a scorecard (Kaplan & Norton, 1992). However, it was not possible to work fully in alignment with the upper management and strategy as innovation management efforts were not well integrated with high-level priorities. However, efforts were made to obtain key input from the stakeholders in order to apply some of the Balanced Scorecard philosophy. As part of the workshop, key questions addressing each of the four Balanced Scorecard perspectives (Kaplan & Norton, 1992) were used and are presented in Table 4.
Table 4. Balanced Scorecard perspectives questions used at the KPI requirements workshop
|
Perspective |
Question |
|
Customer |
To achieve our vision, how should we appear to our customers? |
|
Internal business processes |
To satisfy our shareholders and customers, what business processes must we excel at? |
|
Learning and growth |
To achieve our vision, how will we sustain our ability to change and improve? |
|
Financial |
To succeed financially, how should we appear to our shareholders? |
Finally, of all the topics discussed during the workshop, each participant was asked to identify the single most important one that they believe will demonstrate innovation success. The responses were then clustered in categories and voted on. The “Customer Wow Factor” was determined as the main aspect to measure.
Feedback discussions and KPI decision making
Following the KPI requirements workshop, input from the participants was analyzed and discussed with fellow researchers as well as with the lead academic researcher. During the development of the first KPI proposal, several discussions were held with some of the key stakeholders including the IRDT director, some managers from the IRDT group, and from the Marketing department. The first set of KPIs was then presented to 11 stakeholders for feedback during individual interviews. This led to modifications to the proposed KPIs before the final proposal.
As functional integration has a positive impact on project lead-time and cost (Clark & Fujimoto, 1991; Gomes & Pearson, 2001), Godener and Soderquist (2004) believe that inter-functional processes and measurement can improve the performance of innovation endeavours. However, Engineering and Marketing decision makers were unable to agree on common measures to implement; each group focused on its own interests and avoided getting involved in the other’s KPIs. Unfortunately, this resulted in working separately with Engineering and Marketing stakeholders on different metrics.
Proposed KPIs
The five guiding principles proposed by Dewangan and Godse (2014) and presented above were used for the development of proposed KPIs, as presented in Table 5.
Table 5. Guiding principles for KPI development, based on Dewangan and Godse (2014)
|
Guiding Principle |
Use for Innovation KPI Development Mandate |
|
Multi-dimensional |
A mix of financial/non-financial, hard/soft, and leading/lagging indicators was proposed. |
|
Measuring performance at different stages of the innovation cycle |
Measure several indicators at three stages of the innovation process:
|
|
Addressing organizational stakeholder goals |
Use of input collected through interviews and the KPI requirements workshop |
|
Supporting a cause-and-effect relationship |
Some of the proposed KPIs were hypothesized to help drive behaviours that would address some of the key innovation challenges that the company had (such as proximity to customers and inter-functional integration). |
|
Easy to implement and use (aligned and cascaded through the hierarchy) |
Great care was taken in applying this principle as much as possible despite concerns that the easy metrics are rarely the useful ones (Werner & Souder, 1997). In addition, full alignment with the existing performance measurement systems was not possible in the context of this study. |
The introduction of innovation performance metrics can contribute to higher performance by providing guidance and direction to the innovation efforts (Marginson, 2002). However, it might sometimes be too early to effectively introduce KPIs. According to a review of 10 business process management (BPM) models by Röglinger, Pöppelbuß, and Becker (2012), in most models, the development of KPIs is at maturity level 3 (out of 5). In this case, the company’s innovation processes were assessed as being mostly between BPM maturity level 1 and 2 (Houllier, 2017) by a member of our research team.
In such circumstances, instead of developing KPIs to measure the success of innovation activities, it was decided to focus on KPIs that could help drive the right behaviours to help the company mature its innovation processes and improve its innovation capabilities. Several characteristics of the case company that hindered its ability to continuously develop innovations were identified (Brodeur et al., 2017; Lakiza et al., 2017) and further confirmed by results of an Innovation Quotient (IQ) questionnaire that was used to assess how favourable the company’s culture was to innovation (Rao & Weintraub, 2013).
It was possible to propose a set of KPIs suited for a company with an immature innovation management system working towards rejuvenating its innovation capabilities. Table 6 presents a summary of the KPIs proposed as well as the practices they encourage and the behaviours they are meant to change in order to improve the company’s innovation capabilities over time.
Table 6. Proposed innovation KPIs with encouraged practices and desired behaviour change
|
KPI |
Encouraged Practices |
Desired Behaviour Change and Improvements to Innovation Capabilities |
|
Economic Value for Customers (EVC) |
|
|
|
Innovation Quotient (IQ) score |
|
|
|
Time-to-market |
|
|
|
Sales and number of “launch worthy” products |
|
|
|
Time spent on innovation work |
|
|
Summary of KPI Development Challenges
In summary, there was a significant gap between what came out as the appropriate measures from the stakeholder input activities, the type of measures they were using, and the specific indicators they had in mind for innovation. This is not surprising, as Griffin and Page (1993) found little overlap between the measures used by practitioners and those that they would like to use. When asked why they would not use what they believe would be more useful, the reasons from the survey by Griffin and Page (1993) were:
- Lack of appropriate systems in place (37% of respondents)
- Company culture does not support measuring (17%)
- No one is held accountable for the results (12%)
- Short-term orientation (10%)
- Lack of understanding of the development process (10%)
- No time to measure (8%)
- Measuring is unimportant (6%)
These reasons align well with some of the challenges met when trying to develop innovation KPIs at the case company. As mentioned in the previous section, the level of maturity of the company’s innovation processes was too low for an efficient introduction of innovation KPIs. Therefore, it was decided to focus on KPIs that would help improve innovation capabilities and mature the company’s overall innovation management processes. In addition, four other KPI development challenges were met: the lack of strategic alignment both internally and externally, as well as risk aversion and execution mindset. Table 7 summarizes how the five challenges inhibited the successful development of innovation KPIs.
Table 7. Key challenges and their impact as inhibitors on innovation KPI development
|
Key Challenge |
Desired State |
Overview of the Challenge at the Case Company |
How It Inhibits Development of Innovation KPIs |
|
Risk Aversion |
Innovation requires testing, risk, and some failure before breakthrough (Christensen, 1997; Rao & Weintraub, 2013; Ries, 2011).
|
The employees exhibit risk-averse behaviour, prioritizing projects with incremental improvement and a guarantee to sell today (Garengo et al., 2005). |
Input and hard KPIs are prioritized even though they do not measure the actual success of innovation endeavours, while there is resistance to output KPIs that could show ultimate innovation results a few years later, as well as to soft KPIs that could be drivers of innovation. |
|
Execution Mindset |
Innovation requires stepping out of the day-to-day execution and making time and space to think and test ideas. |
There are few dedicated resources for innovation. These resources mostly get pulled back in response to day-to-day emergencies. |
The execution mindset asks for innovation KPIs that showcase execution of innovation, such as the number of ideas and development projects. These do not encourage activities essential to the development of innovative capabilities. |
|
Internal Alignment |
Information systems allowing quick access to the details when something goes wrong are important (Kaplan & Norton, 1992). |
Lack of alignment does not allow for synergy with existing systems nor for efficient ways to develop and manage cross-functional metrics. |
With data management systems separated by functions, manual work is required to compile inter-functional metrics and to track back and understand how the data was pulled together. There is also a lack of agreement on the kinds of KPIs the key stakeholders want. |
|
Environmental Alignment |
Customer focus and understanding of their needs and expectations is essential for long-term success (Atkinson et al., 1997; Dewangan & Godse, 2014; Godener & Soderquist, 2004; Neely et al., 2002). |
The company is not set up to meet future needs as there is a lack of feedback loops with customers and most development efforts focus on catching up to the competition and to standards requirements. |
The disconnect with the other stakeholders in the industry makes it difficult to have a good understanding of what success would mean and what should be measured and how. |
|
Process Maturity |
Typically, KPIs are introduced at level 3 of BPM maturity (Houllier, 2017; Röglinger et al., 2012). |
Low level of BPM maturity of the innovation management processes. The average maturity level of innovation processes at the time of study was between 1 and 2 (Houllier, 2017). |
KPIs are generally developed at BPM maturity level 3. Other work needs to be done on the development of processes and teams before innovation KPIs can be effectively developed and implemented. |
Recommendations
The results of the IQ questionnaire confirmed that the company’s culture was not favourable to innovation at the time of study. During the development of the innovation KPIs, numerous challenges resulting from the company’s culture were met, such as risk aversion, silos, and an execution-oriented mentality. Based on these challenges, three conditions were identified as prerequisites to implementing successful innovation KPIs: a minimal BPM maturity level of innovation processes, the strategic alignment of the innovation efforts with the company’s goals as well as commitment to innovation. Each of these conditions is addressed in greater detail in the following paragraphs.
First, when most innovation processes are in the early stages of being developed and tested, it is difficult to develop robust and useful KPIs, as the processes that are being measured are themselves in development and constantly change. In a context of limited resources, developing KPIs to measure the performance of immature processes might not be the best investment. KPIs to encourage desired behaviours that are hypothesized to improve future performance might be a more efficient approach than KPIs to measure the performance of innovation processes.
Second, the lack of strategic alignment made this mandate less efficient. It was not possible to fully align the proposed KPIs with the company strategy. In addition, alignment among the innovation stakeholders revealed itself to be a significant challenge in a context of strong silos. Discussions on the KPI development were dragging as both sides were focused on their own ideas, biased by their functional background, and with little common innovation language. A holistic approach is necessary to ensure that the different parts of the company are working together towards higher performance (Kaplan & Norton, 1992). When development work is done without alignment and is not prioritized by upper management, it ends up being half completed or used incorrectly, and is sometimes dropped (Garengo et al., 2005). Experience with these outcomes makes the stakeholders lose faith in such projects and makes similar efforts even more difficult in the future.
Third, there was no commitment, particularly from upper management, towards innovation. The longitudinal research was taking place in the midst of numerous organizational changes, most of which were focused on fixing the company’s operational issues. While many believed that innovation is important, there was no formal commitment to innovation and it was rarely an employee’s priority. Important resources were granted to develop new teams, tools, and processes towards operational excellence, while the IRDT group was struggling to justify a dedicated budget and resources for new product development. While IRDT employees were encouraged to innovate, they were constantly pulled into day-to-day incremental improvements and firefighting. Without commitment, no risk will be sufficiently encouraged as it will never be prioritized over the day-to-day operations.
These three prerequisites also influence one another. When there is real commitment to innovation, it will be part of the company’s strategy and it will be easier to align the innovation management development efforts with the company’s goals. When there is alignment, more resources will be available and focused on developing more solid and mature processes.
These prerequisites are by no means meant to be exhaustive, especially in a general context. They represent the biggest barriers met during the innovation KPI mandate at the case company and are indicative of what can make a similar project challenging in a comparable context.
Discussion and Conclusion
The purpose of this article was to share learnings from the development of innovation KPIs in an execution-oriented Canadian manufacturing company. It brings to light the current state of the literature on innovation performance measurement and proposes steps and guidelines that could be followed to develop appropriate innovation KPIs in an execution-oriented company. The lessons learned and challenges met could benefit managers embarking on a journey to rejuvenate their company’s innovation capabilities, as well as researchers in the field of innovation performance measurement systems and management. However, the specific KPIs proposed in this study may not necessarily be transposable to a different situation, even with a similar context.
Performance measurement systems are idiosyncratic to the context (Bremser & Barsky, 2004; Brophey et al., 2013; Brophey & Brown, 2009; Godener & Soderquist, 2004; Griffin & Page, 1996; Jiménez-Zarco et al., 2006). Thus, our approach was to use guiding principles for an effective performance measurement system by Dewangan and Godse (2014) in order to propose appropriate KPIs for the company at its specific state of innovation management capacity, rather than searching for the “perfect” KPIs.
The mandate at the case company was originally to propose KPIs to measure the success of innovation efforts. The low BPM maturity level of its innovation processes, the lack of strategic alignment, as well as the lack of commitment to innovation made this task very challenging. However, “the measures are not an end point but a dynamic phenomena that must be continually reviewed and developed during the transitional period when creativity and innovation is [sic] developed” (McAdam & Keogh, 2004). Given that a bigger goal was the rejuvenation of innovation capabilities, it made sense to focus on KPIs that would help drive behaviours favourable to innovation and the development of better innovation capabilities rather than KPIs that measure innovation success. If we are right in believing that better innovation processes are the foundation of better innovation performance, this will ultimately have the desired results.
The introduction of KPIs with a goal to encourage behaviours more conducive to innovation is believed to eventually contribute to changing the company’s culture, opening it up to opportunities. With a more intrapreneurial culture, an introduction of KPIs with a goal to measure the success of innovation activities might be easier, as some of the challenges and inhibitors met in this case study will normally be less prominent. For more on this aspect and a conceptual framework on the triple dynamic relationship between intrapreneurial culture, performance measurement systems, and innovation capabilities, see Lakiza (2018).
This case study lays the groundwork for several research opportunities. First, the proposed framework mentioned above, as well as the findings shared in this article, could be further tested in other companies of similar and different types to understand what company aspects have an influence on similar projects. More comprehensive research regarding the barriers to the implementation of innovation KPIs in an execution-oriented company could follow. Additional longitudinal research focusing on innovation KPI implementation and its impacts on the case company’s culture and innovation capabilities a few years later could help verify the propositions raised by our longitudinal action-research study.
Acknowledgements
This work was supported by Mitacs Canada through the Mitacs Accelerate Program, which is sponsored by the Government of Canada and the Government of Quebec. This research would not be possible without the support of the case company and its employees and managers, as well as the academic support of Polytechnique Montreal. The authors also wish to thank other researchers involved in this longitudinal research – Jonathan Brodeur, Amélie Beaulieu, and Guillaume Houllier – for their ongoing contributions and feedback on the mandate described in this article. The authors are also grateful to Dana Giacobbi for his valuable feedback and insights on the concepts and content of this article.
This article was developed from a paper presented at the ISPIM Innovation Forum in Boston, USA, March 25–28, 2018. ISPIM – the International Society for Professional Innovation Management – is a network of researchers, industrialists, consultants, and public bodies who share an interest in innovation management.
References
Atkinson, A. A., Waterhouse, J. H., & Wells, R. B. 1997. A Stakeholder Approach To Strategic Performance Measurement. Sloan Management Review, 38(3): 25.
Bremser, W. G., & Barsky, N. P. 2004. Utilizing the Balanced Scorecard for R&D Performance Measurement. R&D Management, 34(3): 229–238.
https://doi.org/10.1111/j.1467-9310.2004.00335.x
Brodeur, J., Deschamps, I., & Lakiza, V. 2017. NPD Implementation: Beyond Best Practices. Paper presented at the ISPIM Innovation Forum, Toronto, Canada, March 19–22.
Brophey, G., Baregheh, A., & Hemsworth, D. 2013. Innovation Process, Decision-Making, Perceived Risks and Metrics: A Dynamics Test. International Journal of Innovation Management, 17(3): 1340014.
https://doi.org/10.1142/S1363919613400148
Brophey, G., & Brown, S. 2009. Innovation Practices within Small to Medium-Sized Mechanically-Based Manufacturers. Innovation, 11(3): 327–340.
https://doi.org/10.5172/impp.11.3.327
Cameron, W. B. 1963. Informal Sociology: A Casual Introduction to Sociological Thinking. New York: Random House.
Christensen, C. M. 1997. The Innovator’s Dilemma: When New Technologies Cause Great Firms to Fail. Boston, MA: Harvard Business School Press.
Cirka, C. 1997. A Piece of the Puzzle: Employee Responses to Control Practices and Effects on Firm Control Strategy. Philadelphia, PA: Temple University Press.
Clark, K. B., & Fujimoto, T. 1991. Product Development Performance: Strategy, Organization, and Management in the World Auto Industry. Boston, MA: Harvard Business School Press.
Collins, J., & Smith, D. 1999. Innovation Metrics: A Framework to Accelerate Growth. Prism, 2: 33–48.
Cooper, R. G., & Edgett, S. J. 1996. Critical Success Factors for New Financial Services. Marketing Management, 5(3): 26.
Covin, J. G., & Slevin, D. P. 1991. A Conceptual Model of Entrepreneurship as Firm Behavior. Entrepreneurship Theory and Practice, 16(1): 7–25.
https://doi.org/10.1177/104225879101600102
Dewangan, V., & Godse, M. 2014. Towards a Holistic Enterprise Innovation Performance Measurement System. Technovation, 34(9): 536–545.
https://doi.org/10.1016/j.technovation.2014.04.002
Gama, N., Da Silva, M. M., & Ataíde, J. 2007. Innovation Scorecard: A Balanced Scorecard for Measuring the Value Added by Innovation. In P. F. Cunha, & P. G. Maropoulos (Eds.), Digital Enterprise Technology: Perspectives and Future Challenges: 417–424. Boston, MA: Springer US.
Garengo, P., Biazzo, S., & Bititci, U. S. 2005. Performance Measurement Systems in SMEs: A Review for a Research Agenda. International Journal of Management Reviews, 7(1): 25–47.
https://doi.org/10.1111/j.1468-2370.2005.00105.x
Godener, A., & Soderquist, K. E. 2004. Use and Impact of Performance Measurement Results in R&D and NPD: An Exploratory Study. R&D Management, 34(2): 191–219.
https://doi.org/10.1111/j.1467-9310.2004.00333.x
Gomes, J., & Pearson, A. 2001. Effect of NPD Stages and Product Innovativeness on the Relationship Between Functional Integration and Performance. In Proceedings of the 8th EIASM International Product Development Management Conference: 361–372. Enschede, Netherlands: University of Twente.
Griffin, A. 1997. PDMA Research on New Product Development Practices: Updating Trends and Benchmarking Best Practices. Journal of Product Innovation Management, 14(6): 429–458.
https://doi.org/10.1111/1540-5885.1460429
Griffin, A., & Page, A. L. 1993. An Interim Report on Measuring Product Development Success and Failure. Journal of Product Innovation Management, 10: 291–308.
https://doi.org/10.1111/1540-5885.1040291
Griffin, A., & Page, A. L. 1996. PDMA Success Measurement Project: Recommended Measures for Product Development Success and Failure. Journal of Product Innovation Management, 13(6): 478–496.
https://doi.org/10.1111/1540-5885.1360478
Hart, S., Hultink, E. J., Tzokas, N., & Commandeur, H. R. 2003. Industrial Companies’ Evaluation Criteria in New Product Development Gates. Journal of Product Innovation Management, 20(1): 22–36.
https://doi.org/10.1111/1540-5885.201003
Hiebl, M. R. W. 2015. Family Involvement and Organizational Ambidexterity in Later-Generation Family Businesses. Management Decision, 53(5): 1061–1082.
https://doi.org/10.1108/MD-04-2014-0191
Hitt, M. A., Hoskisson, R. E., Johnson, R. A., & Moesel, D. D. 1996. The Market for Corporate Control and Firm Innovation. Academy of Management Journal, 39(5): 1084–1119.
https://doi.org/10.5465/256993
Houllier, G. 2017. Implantation d’un processus de gestion agile des opportunités d’innovation contractuelles dans une entreprise manufacturière. Montreal: Polytechnique Montreal.
Jiménez-Zarco, A. I., Martínez-Ruiz, M. P., & González-Benito, Ó. 2006. Performance Measurement Systems (PMS) Integration into New Product Innovation: A Literature Review and Conceptual Framework. Academy of Marketing Science Review, 9(10): 1–16.
Kaplan, R. S., & Norton, D. P. 1992. The Balanced Scorecard: Measures that Drive Performance. Harvard Business Review, 70(1): 71–79.
Kaplan, R. S., & Norton, D. P. 1996. Using the Balanced Scorecard as a Strategic Management System. Harvard Business Review, 74(1): 75–85.
Kaplan, R. S., & Norton, D. P. 2001. Transforming the Balanced Scorecard from Performance Measurement to Strategic Management: Part I. Accounting Horizons, 15(1): 87–104.
https://doi.org/10.2308/acch.2001.15.1.87
Kerssens-van Drongelen, I. C. 1999. Systematic Design of R&D Performance Measurement Systems. Enschede, Netherlands: Universiteit Twente.
Kerssens-van Drongelen, I. C., & Bilderbeek, J. 1999. R&D Performance Measurement: More than Choosing a Set of Metrics. R&D Management, 29(1): 35–46.
https://doi.org/10.1111/1467-9310.00115
Kerssens-van Drongelen, I. C., Nixon, B., & Pearson, A. 2000. Performance Measurement in Industrial R&D. International Journal of Management Reviews, 2(2): 111–143.
https://doi.org/10.1111/1468-2370.00034
Kirchhoff, B. A., Linton, J. D., & Walsh, S. T. 2013. Neo-Marshellian Equilibrium versus Schumpeterian Creative Destruction: Its Impact on Business Research and Economic Policy. Journal of Small Business Management, 51(2): 159–166.
https://doi.org/10.1111/jsbm.12018
Kuratko, D. F., Covin, J. G., & Hornsby, J. S. 2014. Why Implementing Corporate Innovation Is So Difficult. Business Horizons, 57(5): 647–655.
https://doi.org/10.1016/j.bushor.2014.05.007
Lakiza, V. 2018. Relationships Between Performance Measurement Systems, Intrapreneurial Culture and Innovation Capabilities: A Longitudinal Field Case Study. Montreal: Polytechnique.
Lakiza, V., Deschamps, I., & Brodeur, J. 2017. Propelling Innovation: The Role of Intrapreneurial Culture and Performance Measurement. Paper presented at the ISPIM Innovation Forum, Toronto, Canada, March 19–22.
Lynch, R. L., & Cross, K. F. 1991. Measure Up! Yardsticks for Continuous Improvement. Oxford: Blackwell Business.
Marginson, D. E. W. 2002. Management Control Systems and Their Effects on Strategy Formation at Middle-Management Levels: Evidence from a U.K. Organization. Strategic Management Journal, 23(11): 1019–1031.
https://doi.org/10.1002/smj.271
McAdam, R. 2000. Quality Models in an SME Context. International Journal of Quality & Reliability Management, 17(3): 305–323.
https://doi.org/10.1108/02656710010306166
McAdam, R., & Keogh, W. 2004. Transitioning Towards Creativity and Innovation Measurement in SMEs. Creativity and Innovation Management, 13(2): 126–139.
https://doi.org/10.1111/j.0963-1690.2004.00300.x
Morris, L. 2009. Business Model Innovation The Strategy of Business Breakthroughs. International Journal of Innovation Science, 1(4): 191–204.
https://doi.org/10.1260/1757-2223.1.4.191
Morris, M. H., Allen, J., Schindehutte, M., & Avila, R. 2006. Balanced Management Control Systems as a Mechanism for Achieving Corporate Entrepreneurship. Journal of Managerial Issues: 468–493.
https://www.jstor.org/stable/40604554
Morris, M. H., & Kuratko, D. F. 2002. Corporate Entrepreneurship: Entrepreneurial Development Within Organizations. Nashville, TN: South-Western Publishing Group.
Neely, A. D., Adams, C., & Kennerley, M. 2002. The Performance Prism: The Scorecard for Measuring and Managing Business Success. London: Financial Times/Prentice Hall.
Neely, A. D., Mills, J., Platts, K., Richards, H., Gregory, M., Bourne, M., & Kennerley, M. 2000. Performance Measurement System Design: Developing and Testing a Process‐Based Approach. International Journal of Operations & Production Management, 20(10): 1119–1145.
https://doi.org/10.1108/01443570010343708
Neely, A. D., Richards, H., Mills, J., Platts, K., & Bourne, M. 1997. Designing Performance Measures: A Structured Approach. International Journal of Operations & Production Management, 17(11): 1131–1152.
https://doi.org/10.1108/01443579710177888
Ojanen, V., & Vuola, O. 2005. Coping with the Multiple Dimensions of R&D Performance Analysis. International Journal of Technology Management, 33(2-3): 279–290.
https://doi.org/10.1504/IJTM.2006.008315
Olsson, A., Wadell, C., Odenrick, P., & Bergendahl, M. N. 2010. An Action Learning Method for Increased Innovation Capability in Organisations. Action Learning: Research and Practice, 7(2): 167–179.
https://doi.org/10.1080/14767333.2010.488328
Oriot, F., & Misiaszek, E. 2012. Le Balanced Scorecard au filtre d’une PME française. Ou pourquoi les PME préfèrent le « sur-mesure ». Revue française de gestion, 38(225): 27–43.
http://doi.org/10.3166/rfg.225.27-43
Patton, M. Q. 1987. How to Use Qualitative Methods in Evaluation. Thousand Oaks, CA: Sage.
Perez-Freije, J., & Enkel, E. 2007. Creative Tension in the Innovation Process: How to Support the Right Capabilities. European Management Journal, 25(1): 11–24.
https://doi.org/10.1016/j.emj.2006.11.005
Petersen, A. M., Jung, W. S., Yang, J.-S., & Stanley, H. E. 2010. Quantitative and Empirical Demonstration of the Matthew Effect in a Study of Career Longevity. Proceedings of the National Academy of Sciences, 108(1): 18–23.
https://doi.org/10.1073/pnas.1016733108
Pinchot III, G. 1985. Intrapreneuring: Why You Don’t Have to Leave the Corporation to Become an Entrepreneur. New York: Harper and Row.
Rao, J., & Weintraub, J. 2013. How Innovative Is Your Company’s Culture? MIT Sloan Management Review, 54(3): 9.
Ries, E. 2011. The Lean Startup: How Today’s Entrepreneurs Use Continuous Innovation to Create Radically Successful Businesses. Washington, DC: Crown Books.
Röglinger, M., Pöppelbuß, J., & Becker, J. 2012. Maturity Models in Business Process Management. Business Process Management Journal, 18(2): 328–346.
https://doi.org/10.1108/14637151211225225
Saunila, M. 2016. Performance Measurement Approach for Innovation Capability in SMEs. International Journal of Productivity and Performance Management, 65(2): 162–176.
https://doi.org/10.1108/IJPPM-08-2014-0123
Shih, M. S. H., & Yong, L.-C. 2001. Relationship of Planning and Control Systems with Strategic Choices: A Closer Look. Asia Pacific Journal of Management, 18(4): 481–501.
https://doi.org/10.1023/A:1012875326074
Storey, C., & Kelly, D. 2001. Measuring the Performance of New Service Development Activities. Service Industries Journal, 21(2): 71–90.
https://doi.org/10.1080/714005018
Vorbach, S., & Perl, E. 2007. Decision Making in Innovation Processes: A Concept to Support Small and Medium Sized Enterprises. Journal of Automation Mobile Robotics and Intelligent Systems, 1(4): 3–15.
Werner, B. M., & Souder, W. E. 1997. Measuring R&D Performance – State of the Art. Research Technology Management, 40(2): 34–42.
https://doi.org/10.1080/08956308.1997.11671115
Wolpert, J. D. 2002. Breaking Out of the Innovation Box. Harvard Business Review, 80(8): 76–83.